Power Lab Physiological Data (SpO2, GSR and Heart Rate) Collection Setup in Bays 3
Power Lab introduction
Data acquisition system
- Allows for real-time display of experimental data, online and offline computations and, reversible data manipulation
- The Chart software controls the PowerLab hardware and displays on the computer screen those electrical signals measured by the PowerLab
Chart Features
- Virtual chart recorder with up to 16 channels
- Quick, easy set up of recording parameters
- Recording directly to disk
- Online calculation of heart rate, mean, systolic and diastolic pressure and more
- Easy unit conversion (2 point signal calibration)
- Flexible triggering and stimulation options
- Comment fields during or after recording
- Automation of experimental procedures
- Data analysis and display features which include: statistical measures, data smoothing, interchannel arithmetic and data exclusion
Basics of data acquisition
The purpose of the PowerLab system is to acquire, store and analyze data.
How does data acquisition occur?
- Chart records voltage data from an external source (like a pulse transducer) this raw input signal is in the form of an analog voltage whose amplitude varies over time.
- This voltage is monitored by the hardware and through signal conditioning can amplify, filter, zero… to remove any unwanted steady offset voltage
- After signal conditioning, the analog voltage is sampled at regular intervals
- The signal or sampled voltage is then converted from analog to a digital representation
- The computer software displays the data directly
General Setup
Preparation
In the Control Room
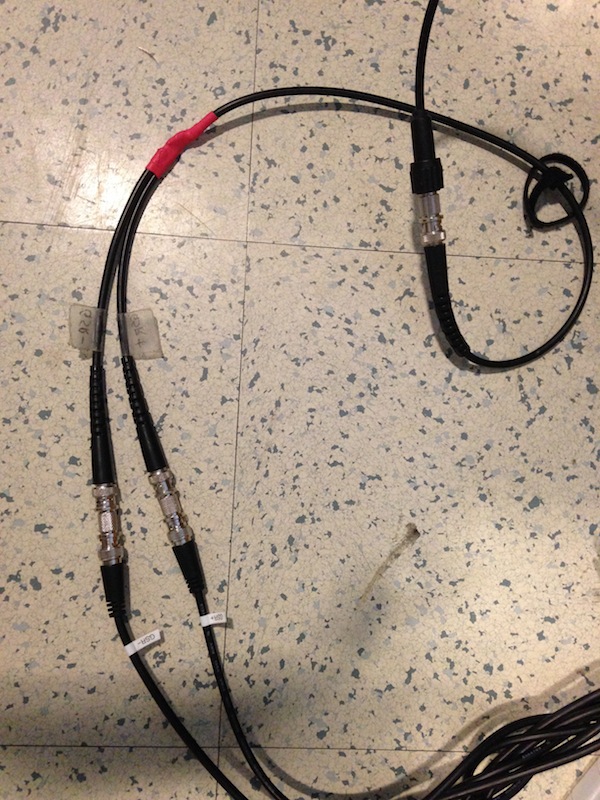
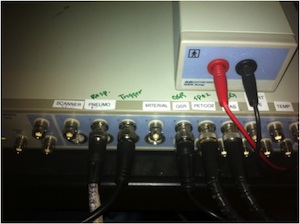
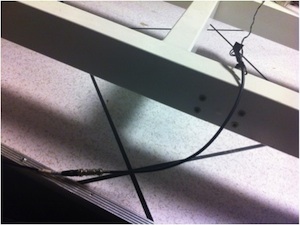
- Find the inputs on the PowerLab labeled Resp, Trigger, GSR (Galvanic Skin Response), ECG, and SpO2. Using five BNC cables, connect to five inputs: respiration, trigger, GSR, SpO2, and ECG [Image 1].
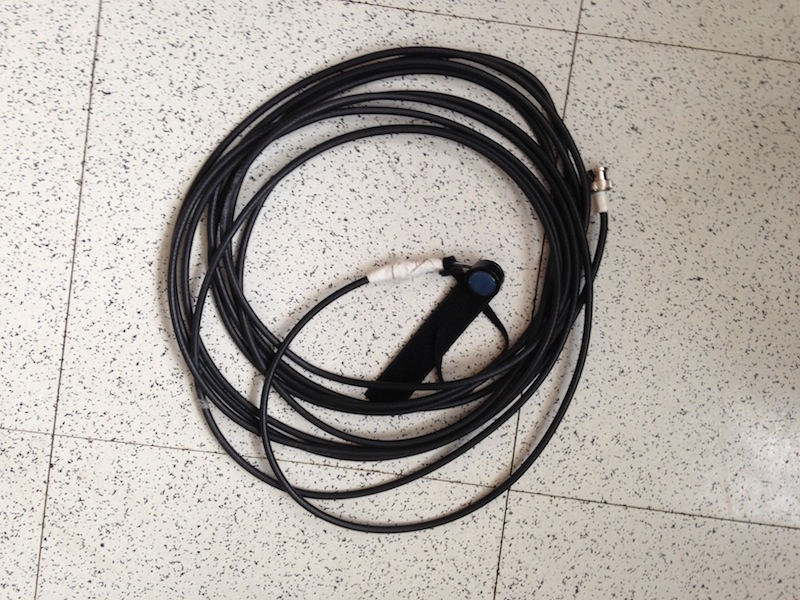
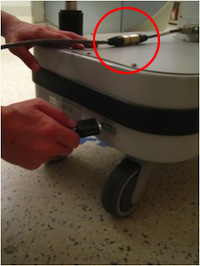
- The GSR cable connects to the narrow end of a Y splitter, and then the fork end of Y splitter connects to the GSR + and GSR – cables located in a box next to the scanner door [Image 2].
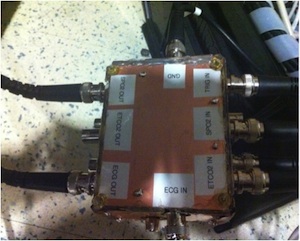
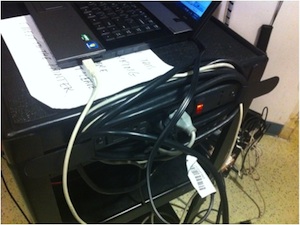
- The SpO2 cable connects to the SpO2 OUT of the copper box [Image3].
- The trigger cable connects to the scanner cable using a T connector. [Image 4] Make sure that it connects to the cable far away from the red letters, and the switch is turned off; otherwise, no trigger signal will be shown.
- The respiration cable connects to the respiration amplifier (as mentioned in section inside power room)
- The piezo cable coming out of ECG (We are using the channel labeled ECG for piezo pulse recording on finger, you could use this channel for other recording) connects to the only spare BNC connector on the p-panel in the power room [Image 5]
- Connect the USB cable from the PowerLab amplifier to the laptop with LabChart installed. Plug in the computer power into the input. Turn on the power. [Image 6]
- Turn on the amplifier located on the back. [Image 7]
|
|
 |
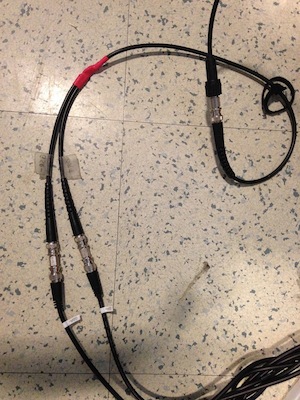 |
Image 01: PowerLab Amplifier |
Image 02: BNC breakout box |
 |
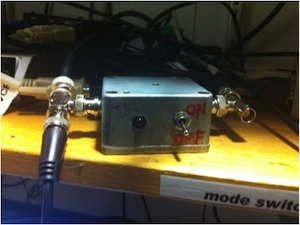 |
Image 03: Copper box |
Image 04: Trigger box |
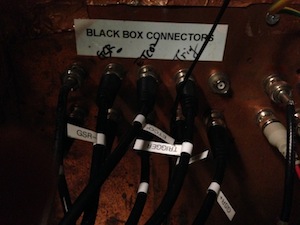 |
Image 05: DB-25 cable |
 |
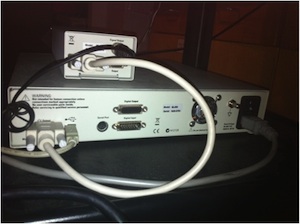 |
Image 06: Computer connection |
Image 07: Back of amplifier |
Inside the Power Room
- The BNC cable that connects to the SpO2 input on the amplifier [Image 1] should be connected to the respiration amplifier using BNC connections. [Images 8] The respiration amplifier is shown in images 9 and 10. Connect the transparent rubber tubing to the respiration amplifier [Image 9], and feed the tubing through the penetration panel [Image 11] into the scanner room. Also plug in the power for the amplifier.
- Plug in the power amplifier for the in vivo system. [Image 12] Feed the power amplifier cable through the penetration panel. [Image 11]
 |
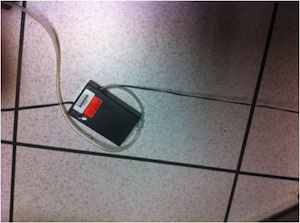 |
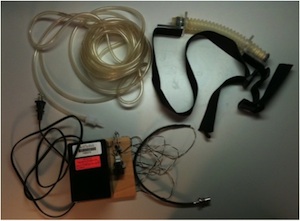
Image 08: Respiration connector |
Image 09: Respiration amplifier |
 |
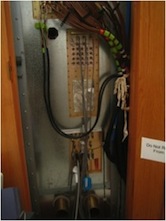 |
Image 10: Respiration amplifier and belt |
Image 11: The penetration panel in Bay 2 |
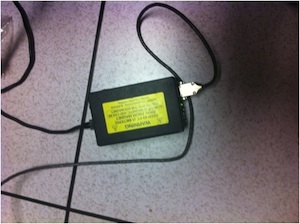 |
Image 12: Power for in vivo system |
Inside the Scanner
- Make sure the serial cable on the copper box [Image 3] (there is a similar copper box inside the scanner with serial cable) is plugged into the InVivo unit. [Image 13]
- Connect the GSR cable to the Y splitter, as shown in Image 2, and then connect the GSR + and GSR – of the Y splitter to the P-panel labeled GSR + and GSR – as shown in Image 5.
- Connect the piezo cable [Image 14] to the corresponding BNC connector on the P-panel [Image 5] (make sure the connector is in the same location as the other side of P-panel).
- Connect the cable of power amplifier [Image 12] that came through the penetration panel [Image 11] from the power room to the In Vivo system as highlighted in red. [Image 13]
- If possible, do not allow subject to wash their hands, as drying will impact sweat levels and electrode contact. A light wash with water is better than most soaps, which tend to dry out the skin.
- When ready to place the GSR electrodes on the subject, place a little isotonic Biopac 101 gel inside the well on the electrode to enhance conductance; make sure do not go over the black circle in the middle. Repeat for another electrode. Wrap the electrodes pads around the patient’s index and middle fingers and tape the open ends. Make sure the pads are touching the skin, not the nail of the fingers. Also make sure the wrapping is tight to have good signals. Do not connect the two clips on the GSR to the electrodes yet. Wait until we have open circuit zero on the Labchart software.
- For the oxygen saturation, SpO2 signal, insert the ring finger into the pocket attached to the SpO2 cable. Make sure the LED is in contact with the skin, not the nail. Tape the pocket around the finger tightly.
- Connect the transparent rubber tubing [Image 9] feed through the penetration panel to the respiration belt. [Image 10] Wrap the belt around patient’s chest.
- Turn on the In Vivo system. Wait till the sound start to beep and press alarm button on the In Vivo system. Check to make sure the oxygen saturation level is within the correct range. (95% - 99%)
 |
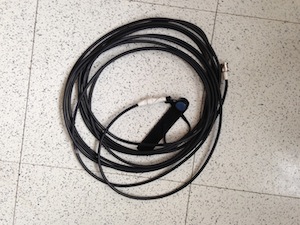 |
Image 13: DB-15 cable plugging into the InVivo unit in scanner |
|
Start Program
GSR
- Open a template, click on save as and give it a name related to subject ID and the date that the patient was scanned.
- Hold on the control key and press the A key to select all of the data in the template file. Press the delete key to delete all of the files.
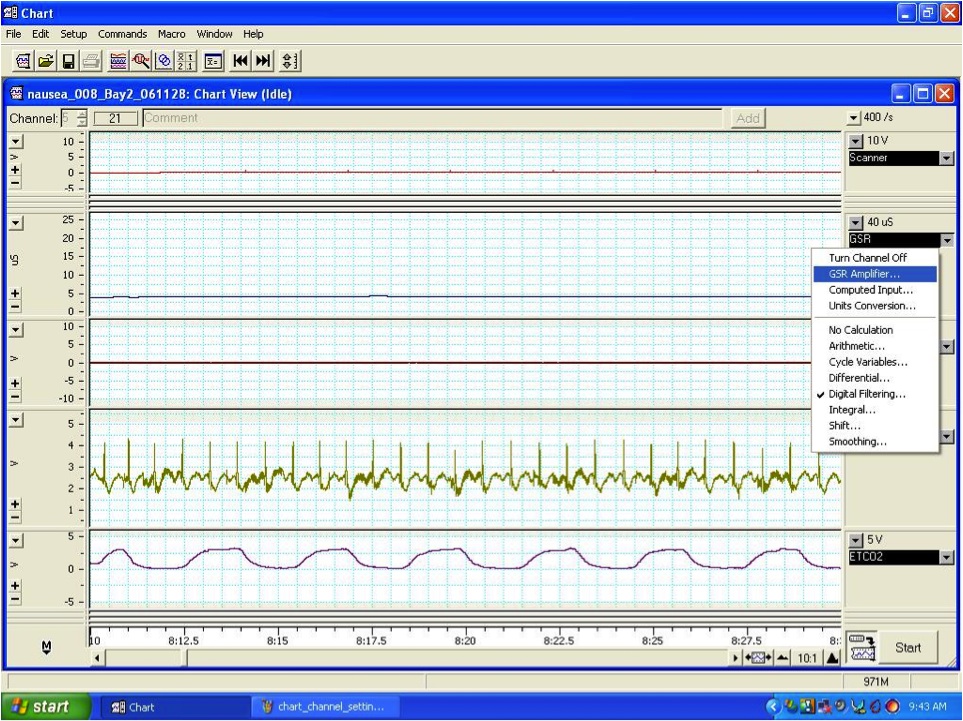
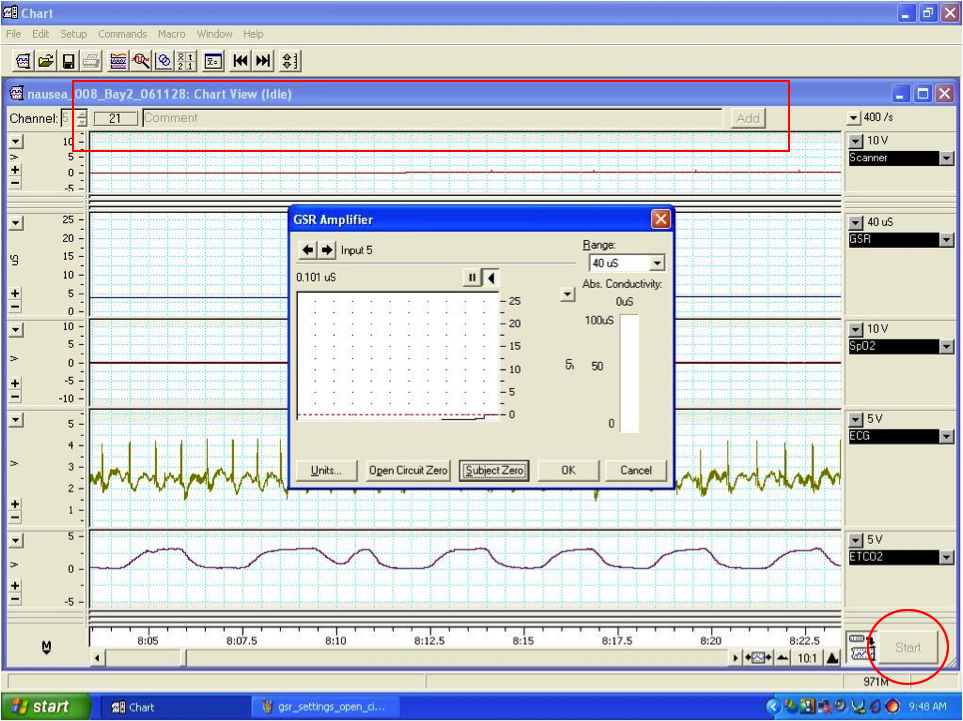
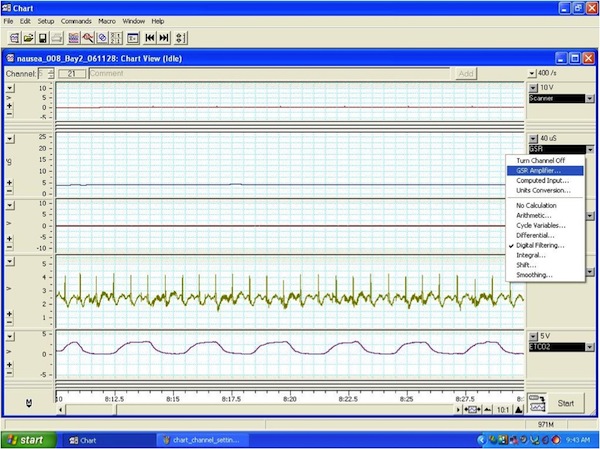
- Go to PowerLab and click on the output for GSR, and select “GSR amplifier” [Image 14]
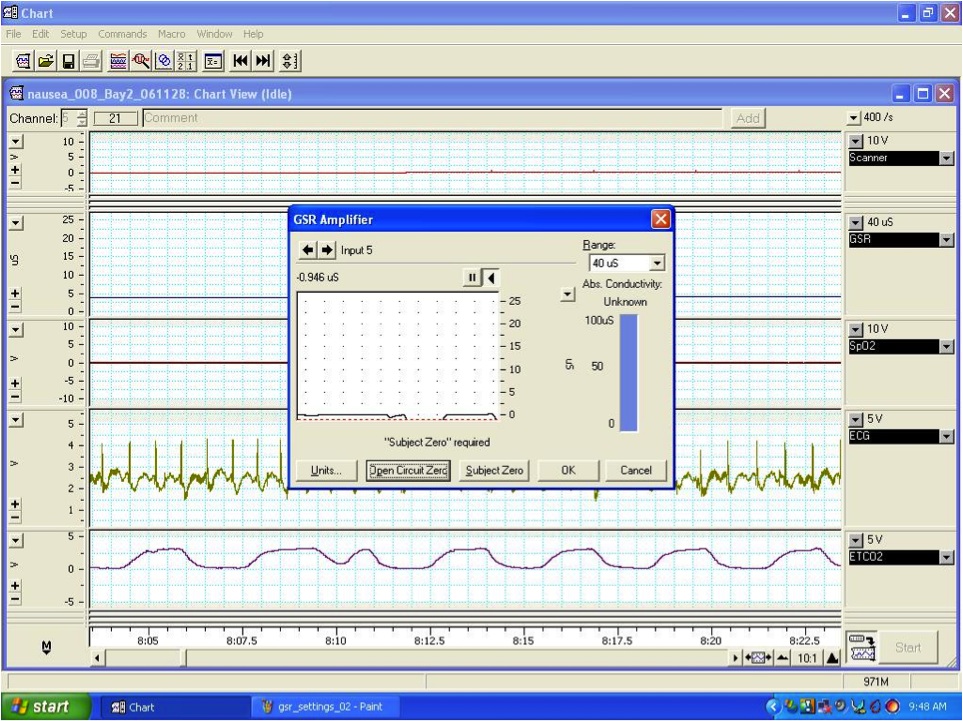
- Click “Open Circuit Zero” (do this before connecting the electrodes to the subject) [Image 15].
- Connect the two electrodes connectors on the GSR cable to the electrodes on the index and middle fingers of the subject
- Note the subject’s GSR level (this may differ for different subjects, they are usually from 10 – 50uS)
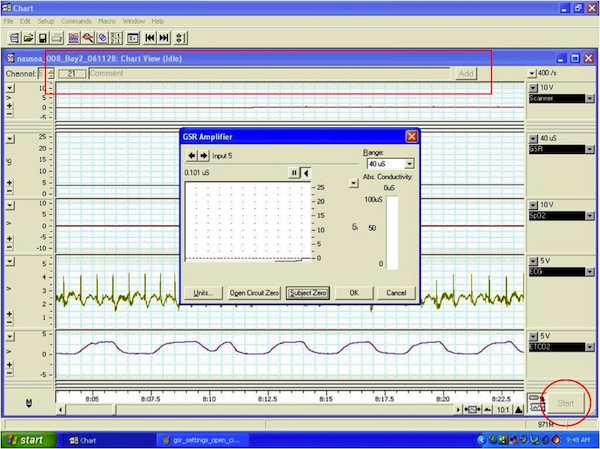
- Click on “Subject zero” and click start at the lower right corner. Then write the GSR level (i.e. 50 uS) into the comment area at the top of the screen. [Image 16]
|
Image 14: Getting to “GSR Amplifier” in chart |

|
Image 15: Screen grab of “Open Circuit Zero” |
|
Image 16: Screen grab of subject zero |
|