

Motivation for the Harvard Ascending Arousal Network Atlas
The ascending arousal network (AAN) is a subcortical neural network that is critical to consciousness. AAN neurons connect the brainstem to the thalamus, hypothalamus, basal forebrain and cortex, activating cortically based awareness networks. The reticular core of the AAN was first described by Moruzzi and Magoun in 1949, who coined the classical term "ascending reticular activating system" (Electroencephalogr Clin Neurophysiol 1949;1:455-73). Here, we use the term AAN because many brainstem nuclei that contribute to arousal are located outside of the pontine and midbrain reticular core (e.g., locus coeruleus, parabrachial complex, etc.), and because we believe that the word "network" appropriately connotes the physiological mechanisms by which multiple modular circuits interrelate to enable the emergent property of arousal, and hence consciousness. To date, the majority of studies investigating AAN connectivity have utilized animal models. As a result, current knowledge about the structural and functional connectivity of the human AAN is limited and largely based upon extrapolations from animal data.
We created this AAN atlas to facilitate research into the structural and functional connectivity of the human AAN. The study of AAN "connectomics" has the potential to increase knowledge about arousal physiology in the human brain, as well as arousal pathology in neurological diseases, such as coma and other disorders of consciousness. In addition, the study of AAN connectomics may advance knowledge about reciprocal connectivity between this subcortical arousal network and cortically based awareness networks, such as the default mode network.
Given the small size (~mm) of AAN brainstem nuclei, the structural complexity of neural circuits within the highly interconnected AAN network, and technical limitations of conventional magnetic resonance imaging (MRI) techniques, the field of human AAN connectomics is in its infancy. In 2012, our laboratory initiated a study of AAN structural connectivity in ex vivo human brain specimens and in a living human subject - a study made possible by high resolution MRI scanners and high angular resolution diffusion imaging (HARDI) sequences developed at the Massachusetts General Hospital Athinoula A. Martinos Center for Biomedical Imaging. With NIH funding of the Human Connectome Project (http://www.humanconnectomeproject.org), the field of AAN connectomics is now expanding due to ultra-high resolution HARDI techniques for structural connectomic analyses and resting-state functional MRI (rs-fMRI) techniques for functional connectivity analyses.
The atlas proposed here is intended to be the first step of an iterative process, whose goal is to provide the academic community with a tool for AAN connectomic analyses. The atlas was generated using several sources of data: 1) histologic data from a dissected ex vivo human brainstem/diencephalon specimen; 2) correlative diffusion data from the same specimen (scanned prior to serial sectioning and staining); and 3) cross-reference to the Paxinos human brainstem atlas (Paxinos G, Xu-Feng H, Sengul G, Watson C. Organization of Brainstem Nuclei, in The Human Nervous System, 3rd ed. Mai JK and Paxinos G eds. Amsterdam: Elsevier, 2011). We expect that the atlas ROIs will be refined over time, as feedback is provided from the academic community and as new tools are developed for even more precise neuroanatomic localization of AAN ROIs. We invite your feedback (see "Contact" link) and will release new versions of the atlas with updated ROIs whenever appropriate.
Atlas Development (Edlow BL, Folkerth RD, and Kinney HC)
1) Correlative Histologic & Radiologic Data from a Human Brainstem/Diencephalon Specimen
HARDI Acquisition and Serial Sectioning/Staining
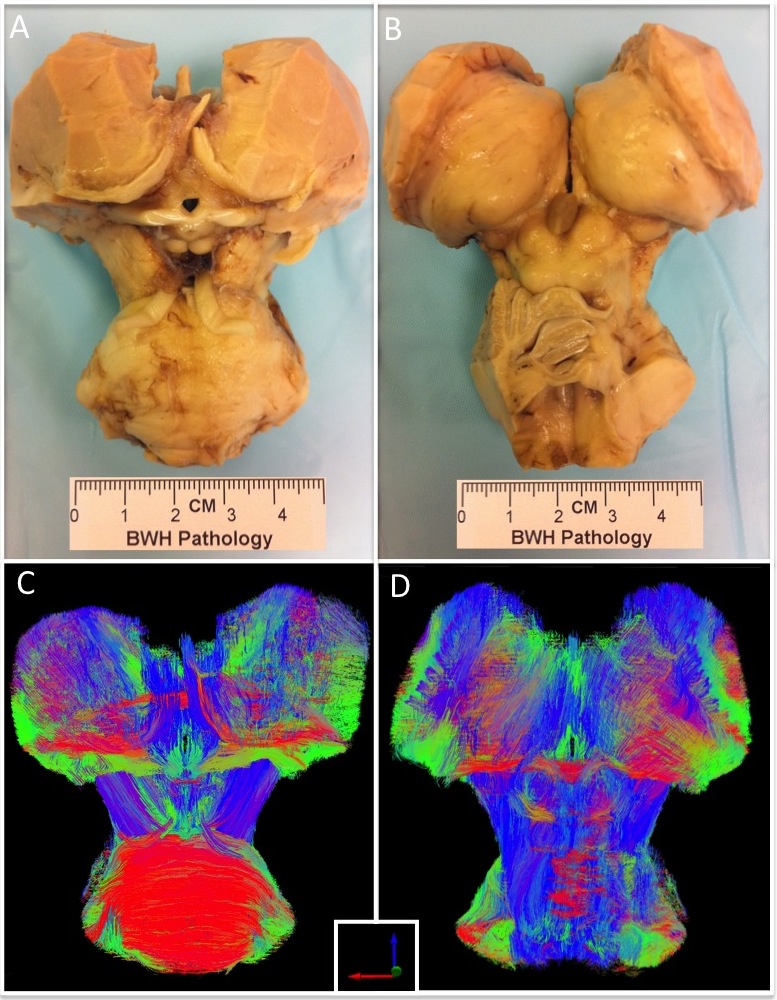
- An ex vivo human brain from a 53-year-old woman who died of non-neurological causes and who had a normal neurological examination prior to death was dissected to a specimen containing the pons, midbrain, thalamus, hypothalamus, and basal forebrain (Figure 1).
- The brainstem/diencephalon specimen was imaged on a 4.7 Tesla Bruker Biospec small-bore MRI scanner using a HARDI sequence with the following parameters: 60 diffusion-encoding directions, b = 4,057 s/mm2, and voxel size ~600 micron isotropic (for additional details, see Edlow et al. JNEN 2012;71:531-546).
 |
|
| Figure 1: Dissected human brainstem, hypothalamus, thalamus, and basal forebrain specimen. (A) Ventral and (B) dorsal views of dissected specimen. (C) Ventral and (D) dorsal views of all fiber tracts comprising the specimen. Tracts are color-coded by direction: red, medial-lateral; green, ventral-dorsal; and blue, rostral-caudal. |
- Upon completion of imaging, the brainstem/diencephalon specimen was serially sectioned (axially through the brainstem, coronally through the diencephalon) using a cryomycrotome. Sections were prepared at 10 µm thickness. Every 50th section was stained with hematoxylin and eosin for nuclear boundaries and counterstained with Luxol fast blue for myelin boundaries. Each stained section was thus separated by 500 µm, providing close correspondence with the HARDI interslice distance of ~600 µm. (We thank Marian Slaney for expert processing of the postmortem brain specimen.)
AAN ROI Development
- Histologic ROIs were delineated by visual inspection with a light microscope and were confirmed by standard atlases of human neuroanatomy. Of note, the 2011 Paxinos human brainstem atlas was not available at the time the ROI analyses were performed, and thus the 1995 Paxinos human brainstem atlas was used for this study (Paxinos G, Huang X. Atlas of the Human Brainstem. San Diego, CA: Academic Press, 1995.)
- HARDI data were visualized using TrackVis (Wang R and Wedeen VJ, www.trackvis.org), and radiologic ROIs were traced manually on the non-diffusion-weighted (b=0 s/mm2) images.
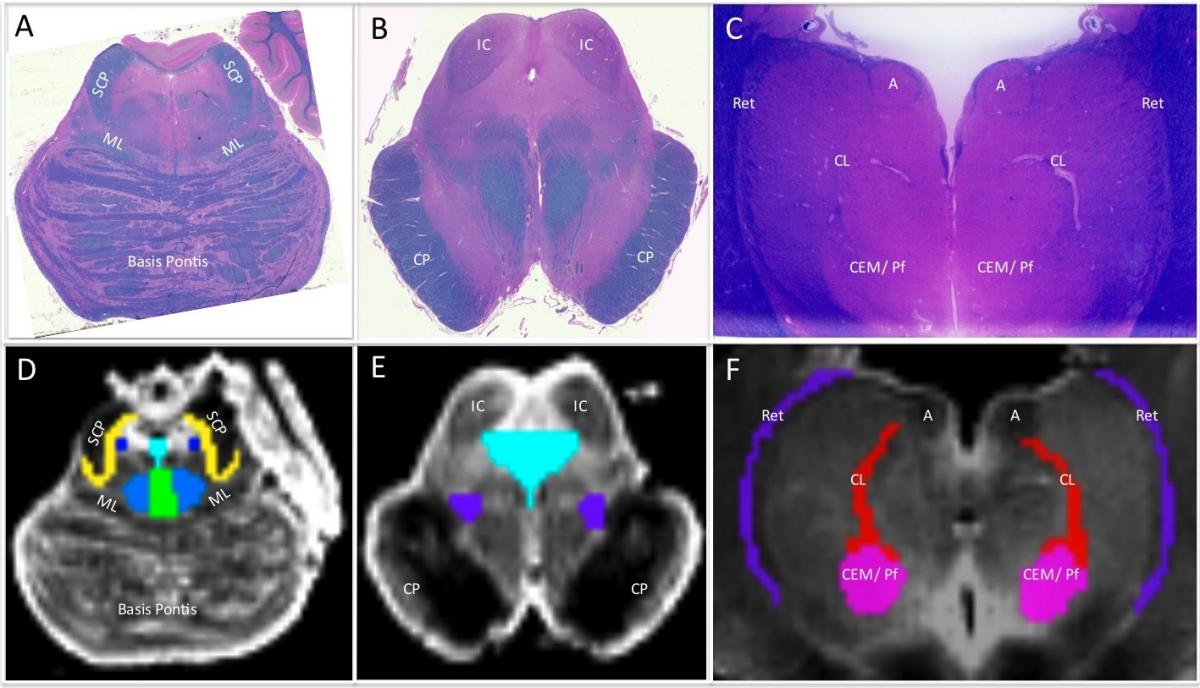
- Each HARDI image was compared with its corresponding histologic section to ensure that the neuroanatomic location, borders, contours, and size of each radiologic ROI was based upon histologic cytoarchitecture (Figure 2).
 |
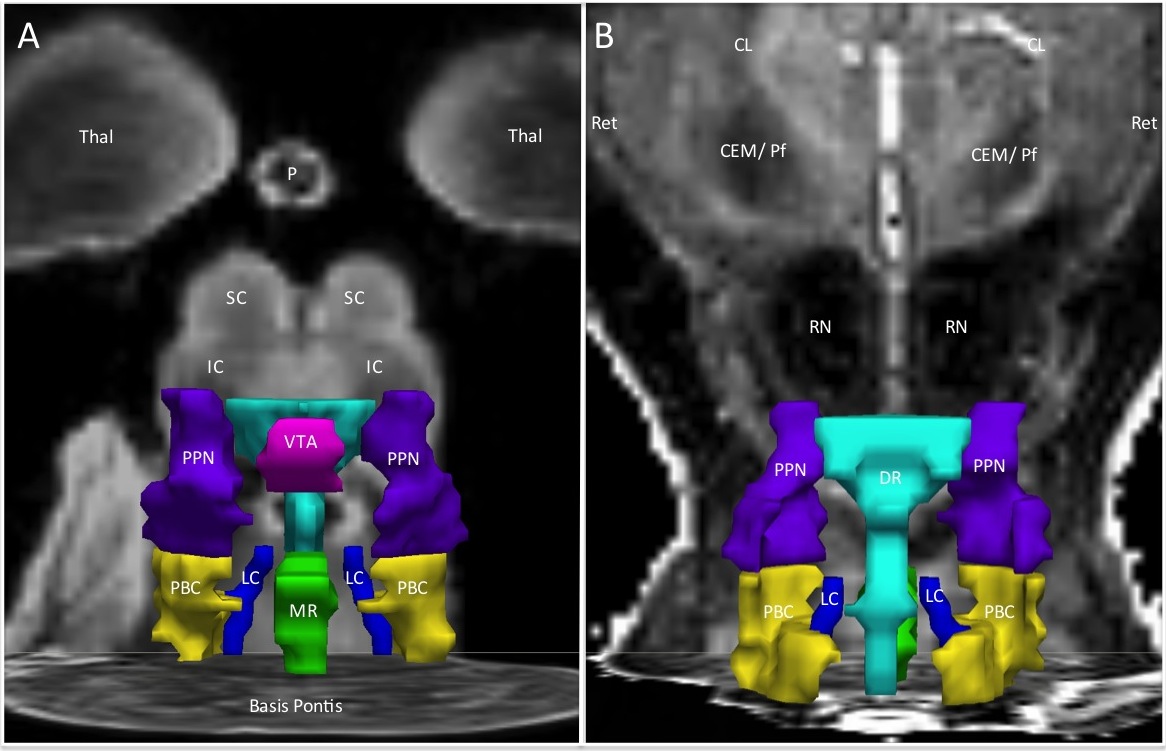 |
| Figure 2: Pontine, midbrain, and thalamic regions of interest: historadiologic correlations. Axial histologic sections from the dissected brain specimen in Case 1 are stained with hematoxylin-and-eosin and counter-stained with Luxol-fast-blue for myelin, at the level of (A) the mid-pons and (B) the caudal midbrain at the level of inferior colliculi (IC). (C) Coronal stained section of the thalamus at the level of the anterior nuclei. Corresponding non-diffusion-weighted images with b = 0 s/mm2 of (D) mid-pons, (E) caudal midbrain, and (F) thalamus. Regions of interest are shown on diffusion images in accordance with neuroanatomic localization determined by the stained neurons on the histological sections: (D, E) dark blue, locus coeruleus; turquoise, dorsal raphé; green, median raphé; light blue, pontis oralis; yellow, parabrachial complex; purple, pendunculopontine nucleus; (F) purple, reticular nucleus of the thalamus (Ret); pink, centromedian/parafascicular complex of the thalamus (CEM/Pf); red, central lateral nucleus of the thalamus (CL). Abbreviations for neuroanatomic landmarks: A, anterior nucleus of the thalamus; SCP, superior cerebellar peduncle; ML, medial lemniscus; CP, cerebral peduncles; and RN, red nuclei. | Figure 3: Three-dimensional anatomy of the brainstem source nuclei of the ascending arousal network. (A) Ventral and (B) dorsal views of 3-dimensional regions of interest (ROIs) in Case 1. ROIs are superimposed on axial and coronal non-diffusion-weighted images with b = 0 s/mm2 in (A) and on apparent diffusion coefficient maps in (B). Three-dimensional ROIs were created using Trackvis software, which renders the 2-dimensional ROIs that were traced on contiguous axial diffusion images (slice thickness 641 µm). Source nuclei abbreviations are as follows: LC, locus coeruleus; DR, dorsal raphé; MR, median raphé; PBC, parabrachial complex; PPN, pendunculopontine nucleus; and VTA, ventral tegmental area. Neuroanatomic landmarks are provided for reference: Thal, thalamus; P, pineal gland; IC, inferior colliculus; SC, superior colliculus; Ret, reticular nucleus of the thalamus; CL, central lateral nucleus; CEM/Pf, centromedian/parafascicular nucleus of the thalamus; and RN, red nucleus. |
2) Paxinos Brainstem Atlas
Paxinos G, Xu-Feng H, Sengul G, Watson C. Organization of Brainstem Nuclei, in The Human Nervous System, 3rd ed. Mai JK and Paxinos G eds. Amsterdam: Elsevier, 2011
- The Paxinos 2011 Brainstem Atlas was used as a reference for confirmation of the neuroanatomic localization, contours, borders, and size for each ROI in the Harvard AAN Atlas.
3) MNI152 Space
Based upon histologic and radiologic data from the JNEN 2012 dataset, as well as reference data from the Paxinos 2011 human brainstem atlas, the ROIs were traced manually in MNI152_1mm space by Brian L. Edlow, MD and Hannah C. Kinney, MD. The neuroanatomic localization, boundaries, and contours were traced in MNI space with precise correlation to the aforementioned datasets.
Downloads
Version 2.0 of the Harvard Ascending Arousal Network Atlas was released on July 18, 2023 and is now available at Dryad Digital Repository: https://datadryad.org/stash/dataset/doi:10.5061/dryad.zw3r228d2
If you use the Harvard AAN Atlas, please cite the following manuscript, which describes the histological data and ex vivo imaging data upon which the atlas is based:
Edlow BL, Takahashi E, Wu O, Benner T, Dai G, Bu L, Grant PE, Greer DM, Greenberg SM, Kinney HC, Folkerth RD. Neuroanatomic connectivity of the human ascending arousal system critical to consciousness and its disorders. Journal of Neuropathology and Experimental Neurology. 2012;71:531-546. PMCID: PMC3387430.