DTI Task Card
Version 1.71 build 2006.12.11 for VA25/VB11/VB12/VB13
Updated: February 06, 2007 01:15:49 PM (EST) Download upgrade
Please read the update log for information about all the changes.
Note: For users who were unable to install the DTI Task Card version 1.70 on VB13 workstations,
please contact us for version 1.71 fresh installer.
Note: New Siemens gradient tables have been added as of December 19, 2006.
For those who downloaded the v1.71 upgrade before that date (and therefore have problem with new Siemens 12 dir data),
please download it again and re-update. Sorry for the inconvenience.
Note: For VB13, you will need 'DTI Evaluation package' (MR_3D_DIFFUSION_BASE)
license from Siemens to run DTI Task Card.
This document describes how to use the task card for
Diffusion Tensor Imaging (DTI Task
Card) on a SIEMENS
NUMARIS 4 satellite console. This task
card allows visualization of diffusion tensor imaging data
and white matter fiber tracking (tractography). A general knowledge of
MRease usage is assumed.
Contents![[top]](images/top.png)
![[down]](images/down.png) Installation
Installation
Detailed Instructions
Loading Image Data
Tensor Viewing
Tractography
Miscellanies
Known Issues
References
Acknowledgment
Further Information
Note: Starting from v1.71, VA21 & VB23 are no longer supported.
Before installation please check if the following
software/hardware requirements are met:
-
Make sure the PC that is about to be installed on is a
Satellite Console (DO NOT INSTALL
THIS SOFTWARE ON MAIN CONSOLE), and the
MRease and Syngo versions match one of the following
versions:
N4_VB13A_LATEST_XXXXXXXX
syngo VE31E
N4_VB11A_LATEST_XXXXXXXX
syngo VD20L
N4_VA25A_LATEST_2004XXXX
syngo VD20L
To find out the version select Help ->
Info and General tab.
-
Due to extensive computation and memory usage of this
software, a fast PC (e.g., dual Intel P4 with 1~2GB RAM) is preferred.
Also, a mid/high end 3D graphics card by ATI or nVidia is STRONGLY
recommended for better performance. Matrox
G400/G450/G550 which was the default graphics card
for old Syngo system is NOT
recommended!
Be sure to set the color depth of the Windows display to
32-bit or True color for best performance.
Also, please read the
license and be aware of the following issues before
installing the DTI Task Card software:
-
Do not install this software on a scanner console.
-
Do not install this software on a satellite console without
approval by SIEMENS.
-
Installation of this software may void any warranty.
-
There is no SIEMENS support or
warranty or liability for this software.
-
There is no other support or warranty or liability for this
software.
To install/upgrade/uninstall the DTI Task
Card, run the setup file "DTI_TaskCard_vXXXX.exe" and follow appropriate steps. DO NOT install unmatched version on your system.
NOTE: If, for any reason, the Syngo system could not start after the installation but you need it up urgently, you may run the installer again and choose remove. That should remove the DTI Task Card and restore your Syngo system.
Attention for VA25/VB11/VB13 version (Windows XP based): After installation the DTI task card will not show up until the data loading starts. It can also be brought up from "Applications" menu.
Loading Image Data
|
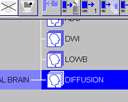
Open the Patient Browser. Select
the series of the original diffusion data to be used for
diffusion tensor map calculation and visualization. Then
click on the DTI button on the
toolbar of the Patient Browser and
select the appropriate type of sequence to load the data
into the DTI Task Card.
NOTE: To add your own DTI gradient directions, modify the configuration file C:\MedCom\Config\DTI\gradient_directions.ini. DO NOT MESS WITH THAT FILE UNLESS YOU KNOW WHAT YOU ARE DOING.
New! Starting from version 1.63, the DTI Task Card can take mosaic data. No need to split the mosaic images anymore.
After data is loaded and calculated, the diffusion
tensors can now be visualized in different patterns and
white matter fiber tracking (tractography) can also be
performed.
Note: According to D. Jones' paper (see references), more diffusion gradient directions and less averages appears preferable for tractography to less diffusion directions and more averages. We would recommend using more number of diffusion directions (e.g., 12 or 24 or even more) for tractography study.
|
|
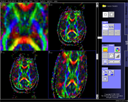
Tensor Viewing
Viewing Mode Buttons
Select between Tensor or Tractography viewing mode.

|
Tensor viewing mode.
|
|

|
Tractography viewing mode.
|
|
Tool Buttons for Tensor Viewing
|
View
|

|
|

|
1:1. Set the current
viewpage the same size of the viewport.
|

|
4:1. Split viewport to
2x2 viewpages.
|

|
9:1. Similar to above.
|

|
16:1. Similar to above.
|

|
Zoom In. Zoom in the current
selected image by a factor of 2.
|

|
Zoom Out. Zoom out the
current selected image by a factor of 2.
|

|
Zoom... Zoom the current
selected image by an arbitrary factor chosen by
user.
|

|
Restore. Restore the current
image's size and position.
|

|
Restore All. Restore all the
images' size and position.
|
|
|
Image
|

|
|
|
 
 
|
Boxoid, Ellipsoid, Plain
Color or Plain
Grayscale. Set the rendering object to
Boxoid or Ellipsoid for the visualization of
diffusion tensor, or just plain color or grayscale
map. The small dark arrow on the right bottom of
the button indicates that a drop-down menu will be
shown if clicked, allowing to select the object.
Note: Ellipsoid rendering can only be allowed when the view page layout is set to 1:1.
|

|
Color Sphere. Show the color
sphere indicating the direction-color coding for
visualization.
|
|

|
Unnormalized Scaling . Set
unnormalized scaling for rendering of the diffusion
tensor object. That is, use the three eigenvalues
as the scaling factors for Boxoid or Ellipsoid object.
This button is only enabled when Boxoid or Ellipsoid is chosen.
|

|
Parallel Viewing. Set the
projection mode to Parallel
or Prospective.
|

|
Interpolate. Turn on/off the
interpolation for Plain
Color or Plain
Grayscale map.
|

|
Noise Threshold. Manually
set the noise threshold for rendering. Noise threshold is used to determine background in Low b image.
|

|
Autoset Noise Threshold.
Automatically set the noise threshold as the mean
value plus 6 times standard deviation of low b
background.
|
|
|
Map
|

|
|

|
FA. Set Fractional
Anisotropy as the weighting factor for current
visualization/maps.
|
 
 
|
E1, E2, E3 or E1-E2. Show E1, E2, E3 or E1-E2 map respectively. Only generic grayscale map is valid at E1, E2 or E3 mode.
|

|
LOWB. Show LOWB maps. Only generic grayscale map is valid at this mode.
|

|
ADC. Show ADC maps. Only generic grayscale map is valid at this mode.
|

|
DWI. Show DWI maps. Only generic grayscale map is valid at this mode.
|

|
EXP. Show Exponential maps. Only generic grayscale map is valid at this mode.
|
|
|
Plane
|

|
|

|
Sagittal. View Sagittal slices.
|

|
Coronal. View Coronal slices.
|

|
Axial. View Axial slices.
|
|
|
Patient
|

|
|

|
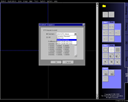
Write New Series. Write new
series into database. There will be a pop-up dialog
allowing to selection what maps (FA, E2-E3, etc.)
to write. The new images can be loaded into the
Viewing Task Card.
The scale factor is 1000 for FA map and 1000,000 for E1, E2, E3, E2E3 and ADC maps.
|

|
Save Map As Analyze File. Save maps (FA, ADC, LOWB, etc. and even tensor and vectors) to local files in analyze format. (NEW!)
|

|
Close Patient. Close the
current patient.
|
|
|
Note:
-
All of the above commands except the ones in
"Patient" category can be found in the main menu on
top of the task card.
-
Move the mouse cursor over each button to show its
tooltip. Tooltip can only be shown when the button
is not grayed.
-
Loading a new series (new patient data) will close
the current loaded patient and clear all the
previously rendered images.
|
Mouse

|
At this cursor, hold left button and drag to move
the image.
|

|
At this cursor, hold left button and drag to zoom
the image.
|

|
Hold right button and drag to rotate the image.
|
|
Hold middle button and drag to change windowing
level of the image. (Note: Color and grayscale
windowing are independent).
|
|
|
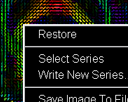
Right-click to bring up popup menu for more
commands.
|
|
|
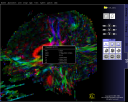
Tractography
Fiber Tracking Steps
|
|
|
Tips:
|
|
Shift Key + Left Mouse
Button to "test-track" in the real time.
|
|
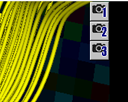
Left Control Key + 1/2/3 to save the current viewing position. Click camera buttons at top-right corner of the image at any time to set the viewing position to the pre-saved ones.
Right Control Key + 1/2/3 to remove the pre-saved viewing positions.
|
|
|
|
Shift Key + Right Mouse Button to view the current voxel info.
|
|
|
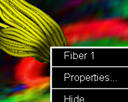
Click right mouse button to bring up popup menu for
the COMPLETE set of commands, such as:
- Enable/disable fast interactive viewing.
-
Hide/Show/Delete/Save fibers/ROIs. NOTE: Saved track points are for reference only and can not be loaded back into the task card. However, ROIs can be saved and loaded.
-
Save fiber as Analyze format volume.(NEW!)
-
Make finished ROI editable.(NEW!)
-
View mean FA, ADC and DWI values of ROI. (NEW!)
-
Changing fiber name and tracking and rendering parameters.
-
Save image to file or database. There are 5 different image formats supported: Jpeg, TIFF, Bitmap, PNG and PostScript.
- Switch on/off stereo rendering. (Needs red/blue 3D glasses to view).
-
Hide/Show annotations and axes.
Some of the commands
are not available from the menu bar or the tool
buttons.
|
|
|
|
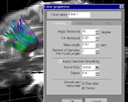
Parameter setting:
|
Tracking parameters
- Angle Threshold. If the turning angle is larger than this value, fiber tracking will stop.
- FA Threshold. If the FA is smaller than this value, fiber tracking will stop.
- Step Length. The step length for the streamline marching algorithm. Recommended setting: about 1/5 ~ 1/4 of the voxel size. Too small will cause much longer tracking time with little improvement on quality and accuracy.
- Number Of Samples Per Voxel Length. The sample rate for the seed region. Recommended value: 1, 2 or 3. WARNING: Setting this value larger will tremendously increase the work load of the fiber tracking and rendering and may cause unexpected error (due to VTK's limitation) if a large seed region is used.
- Smoothing and Interpolation setting. Apply Gaussian smoothing and interpolation on raw data or tensor data.
|
|
|
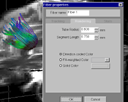
Rendering parameters
- Tube Radius. The radius of the fiber tracks visualized as the many tubes.
- Decimation Factor. Decimation can reduce the number of polygons of the fiber objects without reducing the rendering quality visually. Thus the rendering needs less resources and will be faster. Decimation factor here determines how much decimation to be done. Recommended value: 50%~70%. That means the number of polygons to be rendered is reduced to 50%~30% of the original.
- Color Coding. Color codings for the fiber, includes direction-coded color, solid color and FA-coded color. NOTE: From version 1.62, the DTI Task Card uses a new scheme for direction-color mapping. It may not look as vivid as the old one but it represents the directions more accurately.
|
|
|
|
Tool Buttons for Tractography
|
View
|
|
|

|
FA Color. View FA color map.
|

|
FA. View FA grayscale map.
|

|
Low b. View Low b map.
|

|
Sagittal. Show Sagittal slice.
|

|
Coronal. Show Coronal slice.
|

|
Axial. Show Axial slice.
|

|
Restore To Sagittal. Restore viewing position to Sagittal.
|

|
Restore To Coronal. Restore viewing position to Coronal.
|

|
Restore To Axial. Restore viewing position to Axial.
|
|
|
ROI
|

|
|

|
Define ROI. Define the previously selected voxels as an ROI. The next selected voxel will start a new ROI. If fiber tracking has been performed with previously selected voxels, they are already automatically defined as an ROI.
|

|
Undo Last ROI Editing. Undo the last ROI editing.
|

|
Load ROI. Load ROI from a saved ROI file.
|
| Starting from v1.68, ROI file uses analyze format. Old format is still readable but not writable any more. |
|
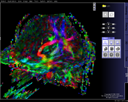
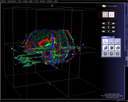
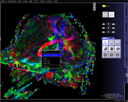
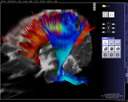
Sample Images
|
Fiber tracking visualization in the
DTI Task Card.
|
|
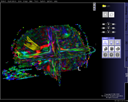
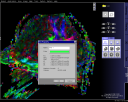
|
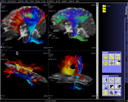
Fiber tracking images saved to the database by
DTI Task Card and loaded in
the Viewing task card afterwards.
|
|
|
Miscellanies
|
Click the copyright texts on the lower right corner of
the screen to bring up About window with version info and
link to this online documentation. Also click the "Live Update" button to check the latest update of the DTI Task Card.
|
|
Known Issues
This software is not an official release and it is not as
tightly integrated into MRease as an
official SIEMENS task card. Due
to this reason, the following known issues may or may not be
solved in the near future.
-
Current version of DTI Task Card can only deal with
single b-value series.
-
The software can work with GE data collected in
Massachusetts General Hospital but is not guaranteed to
work with all kinds of GE data.
-
Computation and pre-rendering are extremely CPU intensive
and memory-consuming and might be slow, especially in
Ellipsoid rendering mode and/or with high resolution images (e.g., 256x256).
-
Due to the limitation of the VTK engine, the tractography tool can not handle too large amount of fibers together at the same rendering. Reducing the "Number of Samples Per Voxel Length" parameter and increasing the "Decimation Factor" parameter in Tracking Options... may help reduce the load of rendering and increase the limitation of the number of fibers that can be rendered together.
The algorithms used for fiber tracking are based on the
following literature:
-
Mori S, Crain BJ, Chacko VP, van Zijl PC.
Three-dimensional tracking of axonal projections in the
brain by magnetic resonance imaging.
Ann Neurol 1999; 45: 265-269.(PubMed abstract)
-
Basser PJ, Pajevic S, Pierpaoli C, Duda J, Aldroubi A.
In vivo fiber tractography using DT-MRI data.
Magn Reson Med 2000;44:625-632.(PubMed abstract)
-
B. Stieltjes, W.E. Kaufmann, P.C. van Zijl, K.
Fredericksen, G.D. Pearlson, M. Solaiyappan and S.Mori.
Diffusion tensor imaging and axonal tracking in the human
brainstem.
Neuroimage 14 (2001), pp.723-735.(PubMed abstract)
-
Mori S, Van Zijl PC.
Fiber tracking: principles and strategies - a technical
review.
NMR Biomed. 2002 Nov-Dec;15(7-8):468-80.(PubMed abstract)
- Jones DK, Horsfield MA, Simmons A.
Optimal strategies for measuring diffusion in anisotropic systems by magnetic resonance imaging.
Magn Reson Med. 1999 Sep;42(3):515-25.(PubMed abstract)
Thanks to David Tuch for the initial idea of tensor visualization.
If you have questions or problems about the DTI Task Card, please contact Ruopeng Wang
<rpwang@nmr.mgh.harvard.edu>.