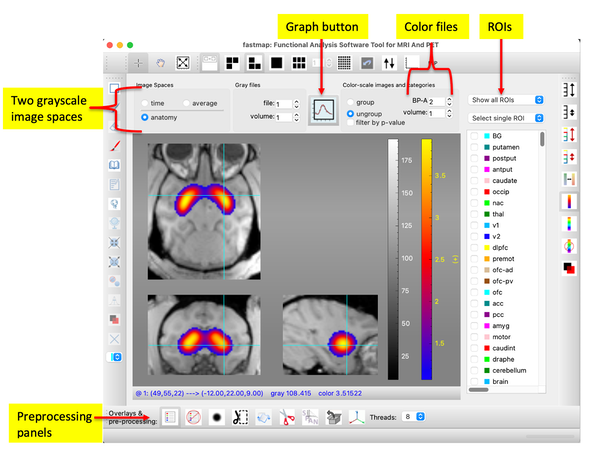
Fastmap is a 4D image displace tool with an additional graph window for showing and analyzing the time dimension. Currently, the program allows 2 (& only 2) spaces to exist simultaneously. The first is the “time-series space”, which will be basis for all time-series analyses. The second is the “anatomy space”, which can hold an anatomical space that may or may not match the time-series space. If spaces are matched in terms of the same voxel dimensions, then cross-hairs, overlays, and color files will be joined across spaces. Tooltips will show information about the current space (dimensions, resolutions) and the current file name and number of time points.
Color files and overlays must match the current time-series space. If the time-series space matches the anatomy space, then color files, overlays, and cross-hairs will be joined across spaces.
Standard time-series analyses will “group” color maps by type (e.g., {BPnd, R1, …} for PET, or {p-value, T-value, signal} for fMRI). Any linear map can also have a p-value threshold applied by clicking “filter by p-value”.
ROIs include those defined explicitly by the user in a text file (typically called “overlay-list.dat”) or extracted from an atlas file. ROIs can be selected individually or in combination. Pre-processing buttons along the bottom will replace the ROI pane with a preprocessing pane.
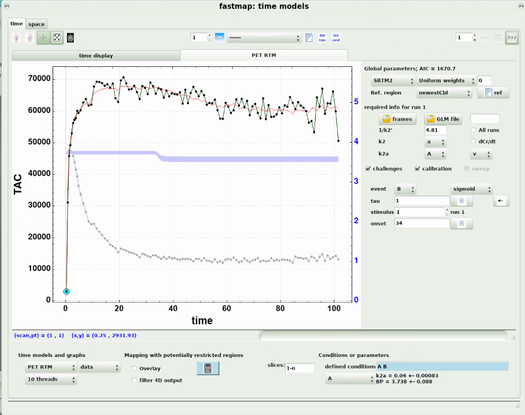
The graph window can be activated by clicking the graph button on the top center of the image window (or by the shortcut “g”). If a 4D dataset is loaded without reference to a time analysis model, the default analysis will be a GLM for fMRi. The analysis model can be selected from the combo box on the left side of the lower panel on the graph window.