0.14.1
  • Get started
  • Tutorials
  • Examples
  • API
  • Manual
  • Contribute
  • FAQ
  • Site

    Logo

    • Examples Gallery
      • Connectivity Analysis Examples
      • Examples on open datasets
      • Decoding / MVPA
      • Forward modeling
      • Inverse problem and source analysis
      • Input/Ouput
      • Preprocessing
      • Real-time M/EEG Acquisition
      • Data Simulation
      • Statistics Examples
      • Time-Frequency Examples
      • Visualization

    Examples Gallery

    Contents

    • Connectivity Analysis Examples
    • Examples on open datasets
    • Decoding / MVPA
    • Forward modeling
    • Inverse problem and source analysis
    • Input/Ouput
    • Preprocessing
    • Real-time M/EEG Acquisition
    • Data Simulation
    • Statistics Examples
    • Time-Frequency Examples
    • Visualization

    Connectivity Analysis Examples

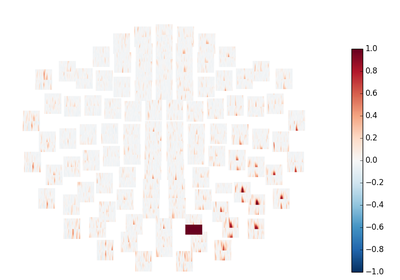
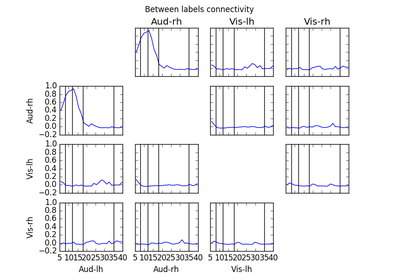
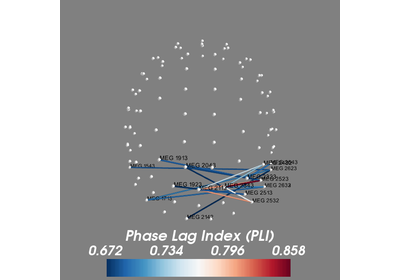
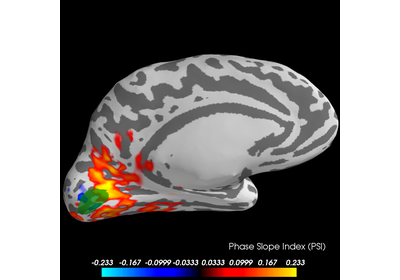
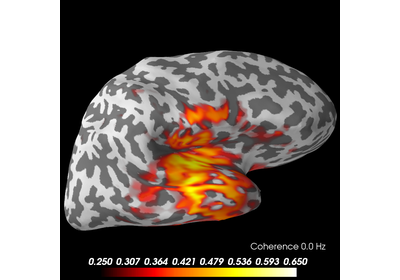
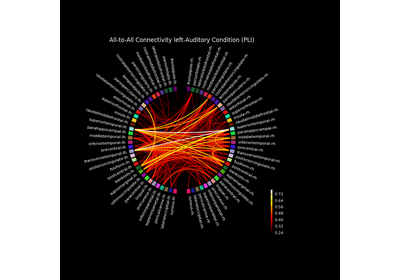
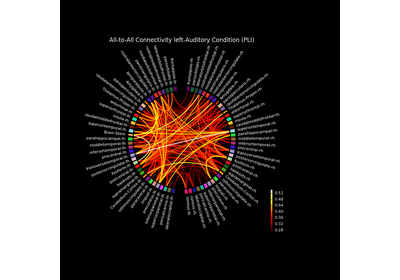
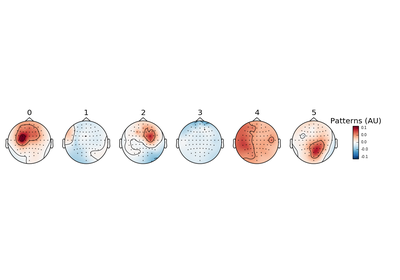
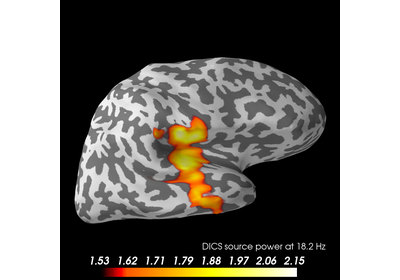
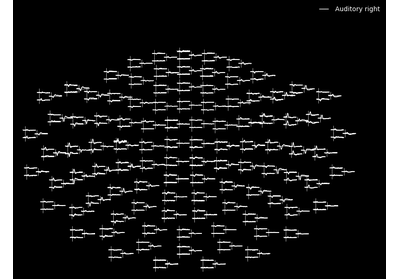
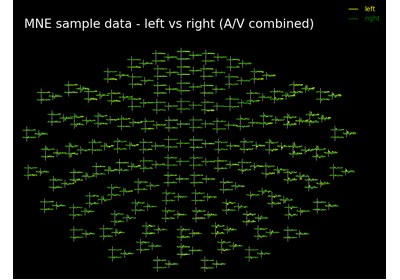
    Examples demonstrating connectivity analysis in sensor and source space.

    ../_images/sphx_glr_plot_cwt_sensor_connectivity_thumb.png

    Compute seed based time-frequency connectivity in sensor space

    ../_images/sphx_glr_plot_mne_inverse_connectivity_spectrum_thumb.png

    Compute full spectrum source space connectivity between labels

    ../_images/sphx_glr_plot_sensor_connectivity_thumb.png

    Compute all-to-all connectivity in sensor space

    ../_images/sphx_glr_plot_mne_inverse_psi_visual_thumb.png

    Compute Phase Slope Index (PSI) in source space for a visual stimulus

    ../_images/sphx_glr_plot_mne_inverse_coherence_epochs_thumb.png

    Compute coherence in source space using a MNE inverse solution

    ../_images/sphx_glr_plot_mne_inverse_label_connectivity_thumb.png

    Compute source space connectivity and visualize it using a circular graph

    ../_images/sphx_glr_plot_mixed_source_space_connectity_thumb.png

    Compute mixed source space connectivity and visualize it using a circular graph

    Examples on open datasets

    Some demos on common/public datasets using MNE.

    ../_images/sphx_glr_plot_megsim_data_single_trial_thumb.png

    MEGSIM single trial simulation dataset

    ../_images/sphx_glr_plot_megsim_data_thumb.png

    MEGSIM experimental and simulation datasets

    ../_images/sphx_glr_plot_brainstorm_data_thumb.png

    Brainstorm tutorial datasets

    ../_images/sphx_glr_plot_spm_faces_dataset_thumb.png

    From raw data to dSPM on SPM Faces dataset

    Decoding / MVPA

    Decoding, a.k.a. MVPA or machine learning examples.

    ../_images/sphx_glr_plot_decoding_unsupervised_spatial_filter_thumb.png

    Analysis of evoked response using ICA and PCA reduction techniques

    ../_images/sphx_glr_plot_decoding_time_generalization_conditions_thumb.png

    Decoding sensor space data with generalization across time and conditions

    ../_images/sphx_glr_plot_decoding_xdawn_eeg_thumb.png

    XDAWN Decoding From EEG data

    ../_images/sphx_glr_plot_linear_model_patterns_thumb.png

    Linear classifier on sensor data with plot patterns and filters

    ../_images/sphx_glr_plot_decoding_csp_space_thumb.png

    Decoding in sensor space data using the Common Spatial Pattern (CSP)

    ../_images/sphx_glr_plot_ems_filtering_thumb.png

    Compute effect-matched-spatial filtering (EMS)

    ../_images/sphx_glr_decoding_rsa_thumb.png

    Representational Similarity Analysis

    ../_images/sphx_glr_plot_decoding_csp_eeg_thumb.png

    Motor imagery decoding from EEG data using the Common Spatial Pattern (CSP)

    ../_images/sphx_glr_plot_decoding_spatio_temporal_source_thumb.png

    Decoding source space data

    Forward modeling

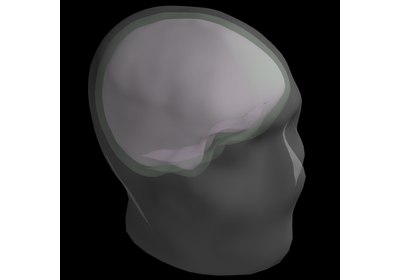
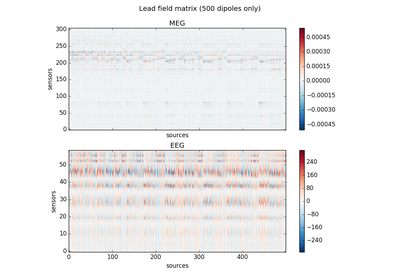
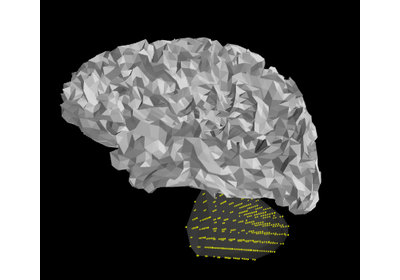
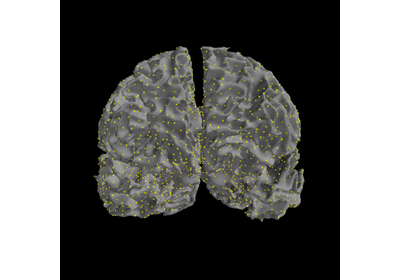
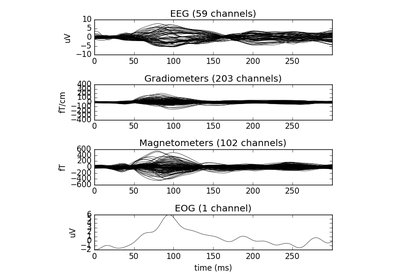
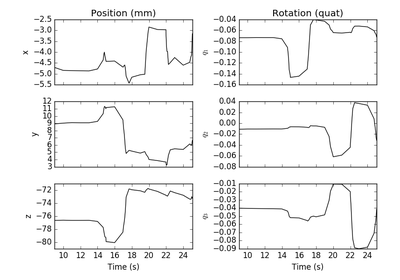
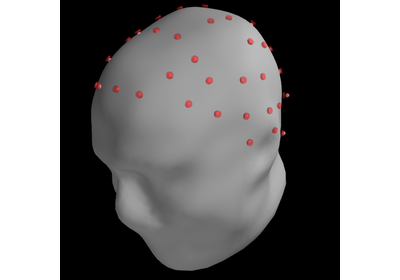
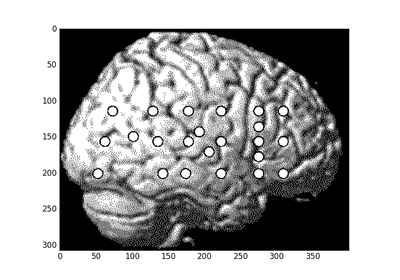
    From BEM segmentation, coregistration, setting up source spaces to actual computation of forward solution.

    ../_images/sphx_glr_plot_read_bem_surfaces_thumb.png

    Reading BEM surfaces from a forward solution

    ../_images/sphx_glr_plot_decimate_head_surface_thumb.png

    Decimating scalp surface

    ../_images/sphx_glr_plot_forward_sensitivity_maps_thumb.png

    Display sensitivity maps for EEG and MEG sensors

    ../_images/sphx_glr_plot_source_space_morphing_thumb.png

    Use source space morphing

    ../_images/sphx_glr_plot_left_cerebellum_volume_source_thumb.png

    Generate a left cerebellum volume source space

    Inverse problem and source analysis

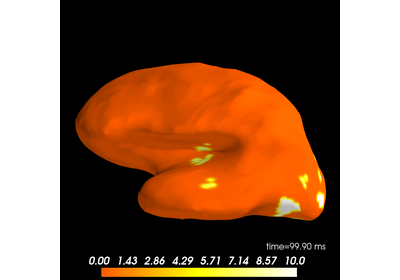
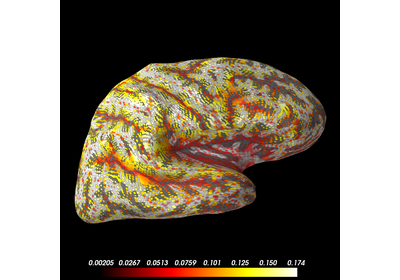
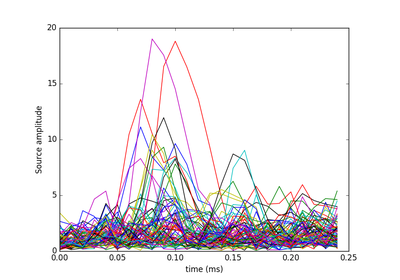
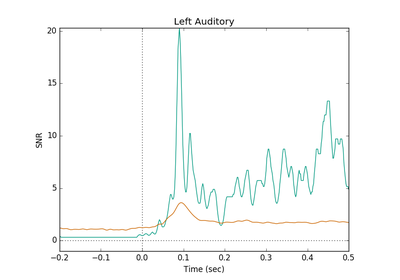
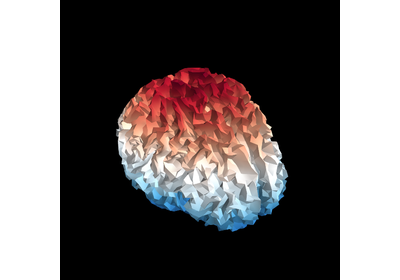
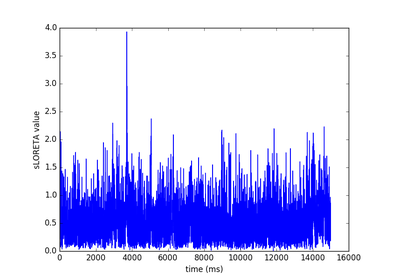
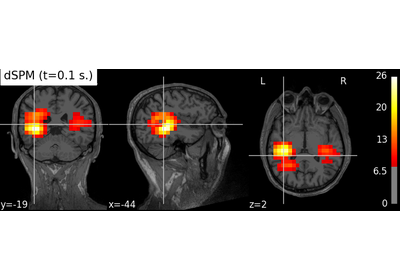
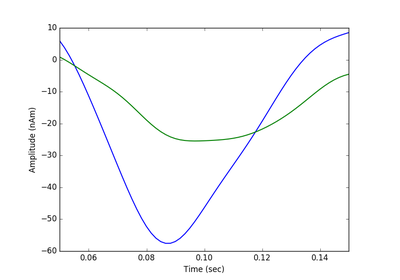
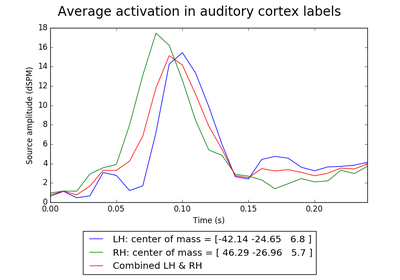
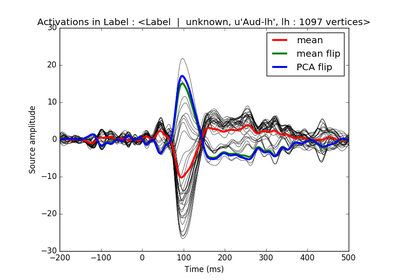
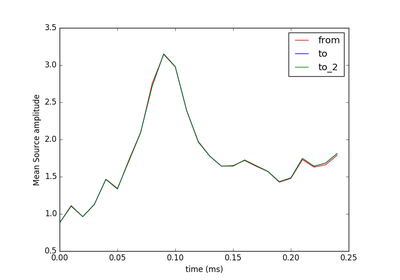
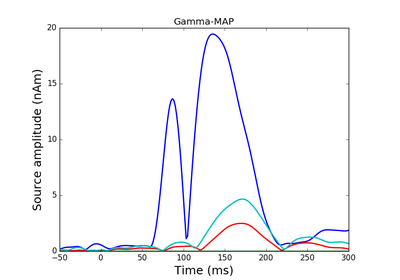
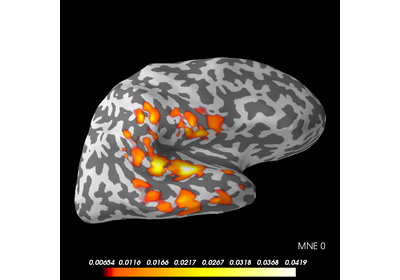
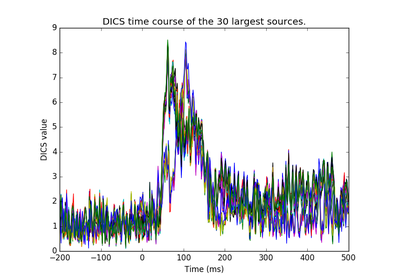
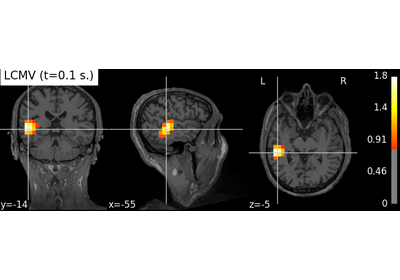
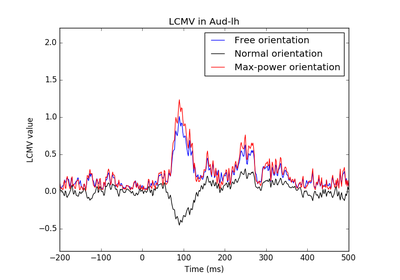
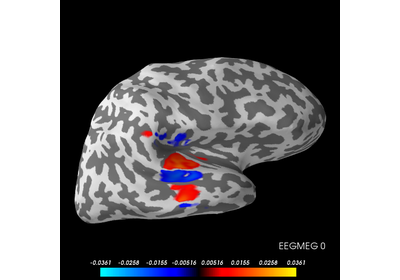
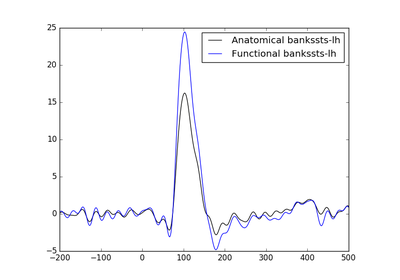
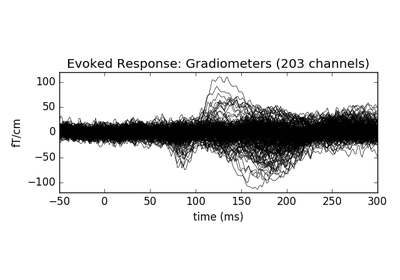
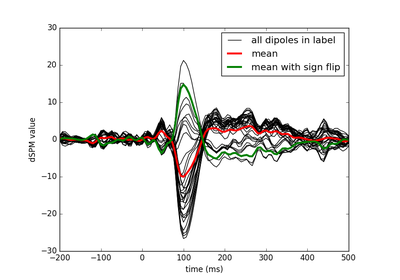
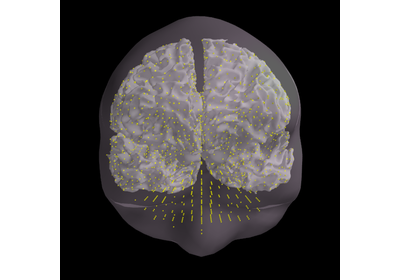
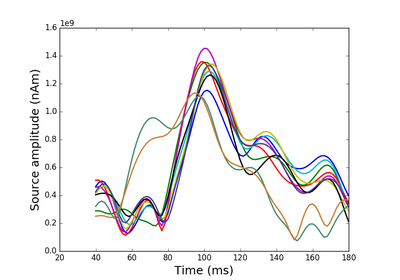
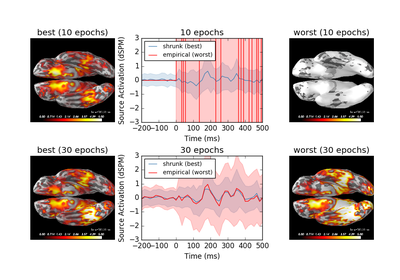
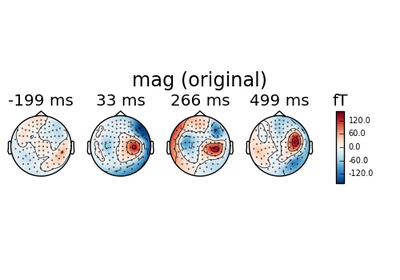
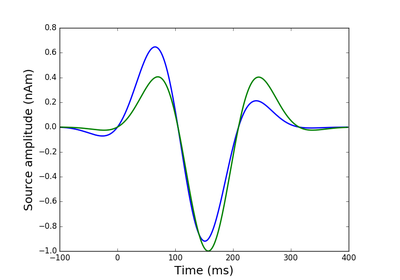
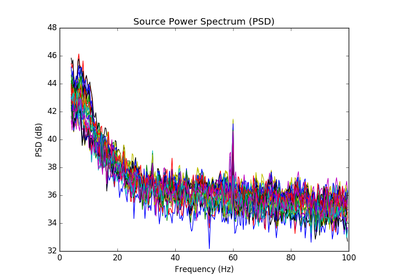
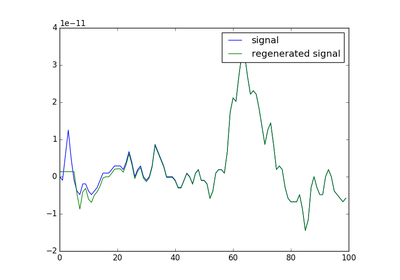
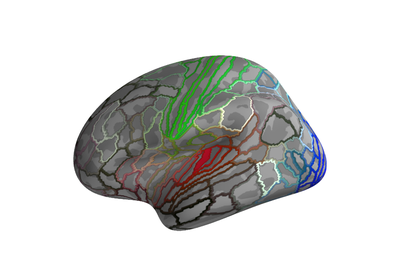
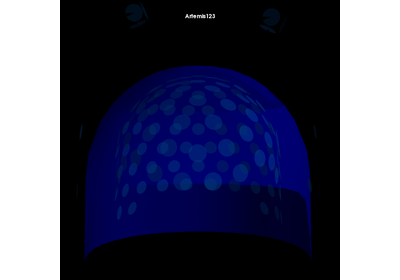
    Estimate source activations, extract activations in labels, morph data between subjects etc.

    ../_images/sphx_glr_plot_read_source_space_thumb.png

    Reading a source space from a forward operator

    ../_images/sphx_glr_plot_read_stc_thumb.png

    Reading an STC file

    ../_images/sphx_glr_plot_snr_estimate_thumb.png

    Plot an estimate of data SNR

    ../_images/sphx_glr_plot_read_inverse_thumb.png

    Reading an inverse operator

    ../_images/sphx_glr_plot_compute_mne_inverse_raw_in_label_thumb.png

    Compute sLORETA inverse solution on raw data

    ../_images/sphx_glr_plot_compute_mne_inverse_volume_thumb.png

    Compute MNE-dSPM inverse solution on evoked data in volume source space

    ../_images/sphx_glr_plot_rap_music_thumb.png

    Compute Rap-Music on evoked data

    ../_images/sphx_glr_plot_label_activation_from_stc_thumb.png

    Extracting time course from source_estimate object

    ../_images/sphx_glr_plot_label_source_activations_thumb.png

    Extracting the time series of activations in a label

    ../_images/sphx_glr_plot_morph_data_thumb.png

    Morph source estimates from one subject to another subject

    ../_images/sphx_glr_plot_gamma_map_inverse_thumb.png

    Compute a sparse inverse solution using the Gamma-Map empirical Bayesian method

    ../_images/sphx_glr_plot_mne_crosstalk_function_thumb.png

    Compute cross-talk functions (CTFs) for labels for MNE/dSPM/sLORETA

    ../_images/sphx_glr_plot_dics_source_power_thumb.png

    Compute source power using DICS beamfomer

    ../_images/sphx_glr_plot_dics_beamformer_thumb.png

    Compute DICS beamfomer on evoked data

    ../_images/sphx_glr_plot_mixed_norm_inverse_thumb.png

    Compute sparse inverse solution with mixed norm: MxNE and irMxNE

    ../_images/sphx_glr_plot_lcmv_beamformer_volume_thumb.png

    Compute LCMV inverse solution on evoked data in volume source space

    ../_images/sphx_glr_plot_lcmv_beamformer_thumb.png

    Compute LCMV beamformer on evoked data

    ../_images/sphx_glr_plot_mne_point_spread_function_thumb.png

    Compute point-spread functions (PSFs) for MNE/dSPM/sLORETA

    ../_images/sphx_glr_plot_label_from_stc_thumb.png

    Generate a functional label from source estimates

    ../_images/sphx_glr_plot_time_frequency_mixed_norm_inverse_thumb.png

    Compute MxNE with time-frequency sparse prior

    ../_images/sphx_glr_plot_compute_mne_inverse_epochs_in_label_thumb.png

    Compute MNE-dSPM inverse solution on single epochs

    ../_images/sphx_glr_plot_tf_dics_thumb.png

    Time-frequency beamforming using DICS

    ../_images/sphx_glr_plot_mixed_source_space_inverse_thumb.png

    Compute MNE inverse solution on evoked data in a mixed source space

    ../_images/sphx_glr_plot_custom_inverse_solver_thumb.png

    Source localization with a custom inverse solver

    ../_images/sphx_glr_plot_tf_lcmv_thumb.png

    Time-frequency beamforming using LCMV

    ../_images/sphx_glr_plot_covariance_whitening_dspm_thumb.png

    Demonstrate impact of whitening on source estimates

    Input/Ouput

    Reading and writing files. See also our Tutorials on manipulating data structures.

    ../_images/sphx_glr_plot_read_noise_covariance_matrix_thumb.png

    Reading/Writing a noise covariance matrix

    ../_images/sphx_glr_plot_read_evoked_thumb.png

    Reading and writing an evoked file

    ../_images/sphx_glr_read_events_thumb.png

    Reading an event file

    ../_images/sphx_glr_plot_read_and_write_raw_data_thumb.png

    Reading and writing raw files

    ../_images/sphx_glr_plot_read_epochs_thumb.png

    Reading epochs from a raw FIF file

    ../_images/sphx_glr_plot_elekta_epochs_thumb.png

    Getting averaging info from .fif files

    ../_images/sphx_glr_plot_objects_from_arrays_thumb.png

    Creating MNE objects from data arrays

    Preprocessing

    Examples related to data preprocessing (artifact detection / rejection etc.)

    ../_images/sphx_glr_plot_head_positions_thumb.png

    Visualize subject head movement

    ../_images/sphx_glr_plot_interpolate_bad_channels_thumb.png

    Interpolate bad channels for MEG/EEG channels

    ../_images/sphx_glr_plot_virtual_evoked_thumb.png

    Remap MEG channel types

    ../_images/sphx_glr_plot_run_ica_thumb.png

    Compute ICA components on epochs

    ../_images/sphx_glr_plot_find_eog_artifacts_thumb.png

    Find EOG artifacts

    ../_images/sphx_glr_plot_find_ecg_artifacts_thumb.png

    Find ECG artifacts

    ../_images/sphx_glr_plot_shift_evoked_thumb.png

    Shifting time-scale in evoked data

    ../_images/sphx_glr_plot_eog_artifact_histogram_thumb.png

    Show EOG artifact timing

    ../_images/sphx_glr_plot_movement_compensation_thumb.png

    Maxwell filter data with movement compensation

    ../_images/sphx_glr_plot_xdawn_denoising_thumb.png

    XDAWN Denoising

    ../_images/sphx_glr_plot_rereference_eeg_thumb.png

    Re-referencing the EEG signal

    ../_images/sphx_glr_plot_resample_thumb.png

    Resampling data

    ../_images/sphx_glr_plot_define_target_events_thumb.png

    Define target events based on time lag, plot evoked response

    Real-time M/EEG Acquisition

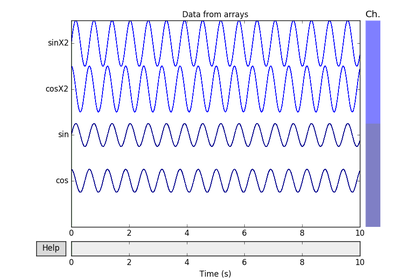
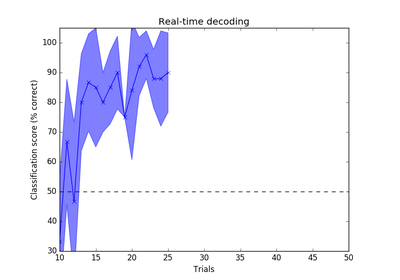
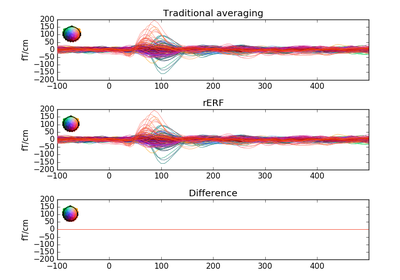
    Receive data from an MNE Real-time server (mne_rt_server, part of MNE-CPP), compute real-time moving averages, etc.

    ../_images/sphx_glr_plot_compute_rt_average_thumb.png

    Compute real-time evoked responses using moving averages

    ../_images/sphx_glr_ftclient_rt_average_thumb.png

    Compute real-time evoked responses with FieldTrip client

    ../_images/sphx_glr_ftclient_rt_compute_psd_thumb.png

    Compute real-time power spectrum density with FieldTrip client

    ../_images/sphx_glr_rt_feedback_client_thumb.png

    Real-time feedback for decoding :: Client Side

    ../_images/sphx_glr_plot_compute_rt_decoder_thumb.png

    Decoding real-time data

    ../_images/sphx_glr_rt_feedback_server_thumb.png

    Real-time feedback for decoding :: Server Side

    Data Simulation

    Tools to generate simulation data.

    ../_images/sphx_glr_plot_simulate_evoked_data_thumb.png

    Generate simulated evoked data

    ../_images/sphx_glr_plot_simulate_raw_data_thumb.png

    Generate simulated raw data

    Statistics Examples

    Some examples of how to compute statistics on M/EEG data with MNE.

    ../_images/sphx_glr_plot_linear_regression_raw_thumb.png

    Regression on continuous data (rER[P/F])

    ../_images/sphx_glr_plot_sensor_regression_thumb.png

    Sensor space least squares regression

    ../_images/sphx_glr_plot_fdr_stats_evoked_thumb.png

    FDR correction on T-test on sensor data

    ../_images/sphx_glr_plot_sensor_permutation_test_thumb.png

    Permutation T-test on sensor data

    ../_images/sphx_glr_plot_cluster_stats_evoked_thumb.png

    Permutation F-test on sensor data with 1D cluster level

    Time-Frequency Examples

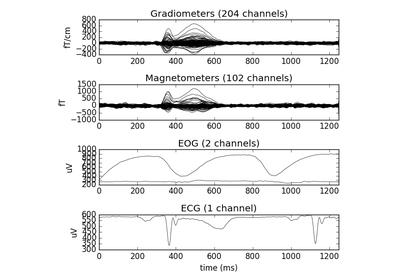
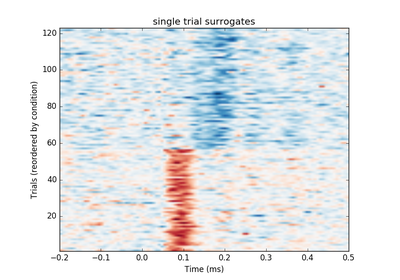
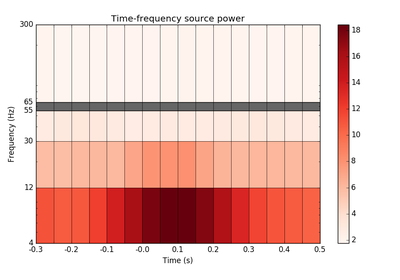
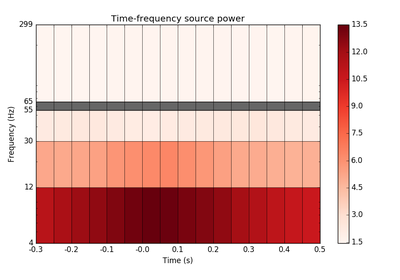
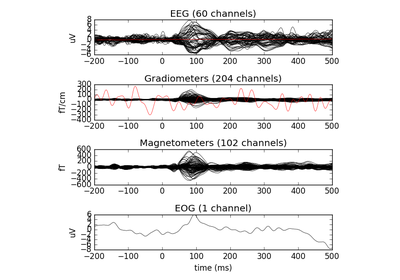
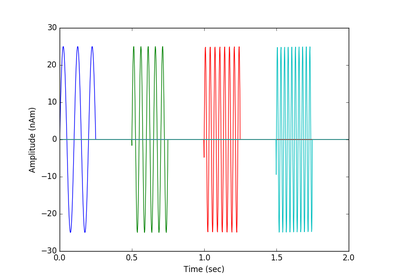
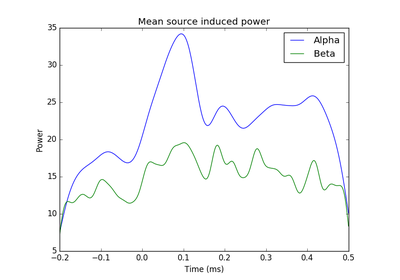
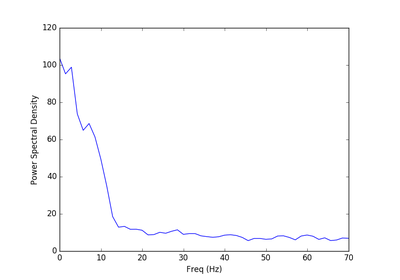
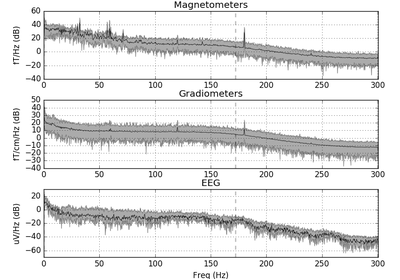
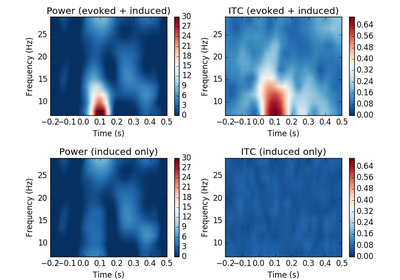
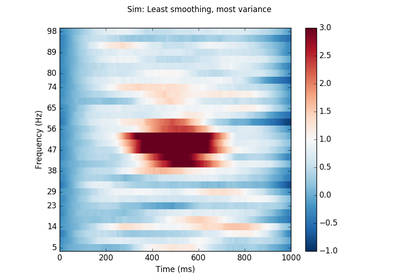
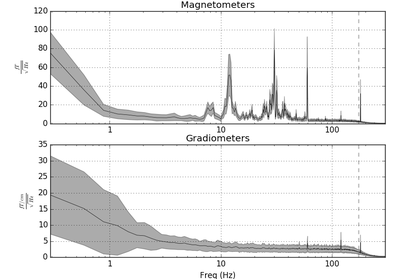
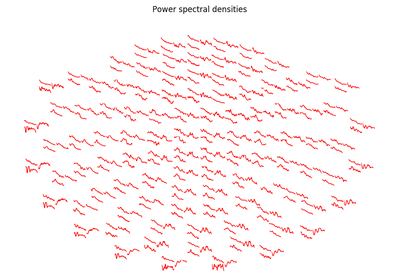
    Some examples of how to explore time-frequency content of M/EEG data with MNE.

    ../_images/sphx_glr_plot_source_power_spectrum_thumb.png

    Compute power spectrum densities of the sources with dSPM

    ../_images/sphx_glr_plot_temporal_whitening_thumb.png

    Temporal whitening with AR model

    ../_images/sphx_glr_plot_source_space_time_frequency_thumb.png

    Compute induced power in the source space with dSPM

    ../_images/sphx_glr_plot_compute_source_psd_epochs_thumb.png

    Compute Power Spectral Density of inverse solution from single epochs

    ../_images/sphx_glr_plot_compute_raw_data_spectrum_thumb.png

    Compute the power spectral density of raw data

    ../_images/sphx_glr_plot_source_label_time_frequency_thumb.png

    Compute power and phase lock in label of the source space

    ../_images/sphx_glr_plot_time_frequency_simulated_thumb.png

    Time-frequency on simulated data (Multitaper vs. Morlet)

    Visualization

    Looking at data and processing output.

    ../_images/sphx_glr_plot_sensor_noise_level_thumb.png

    Show noise levels from empty room data

    ../_images/sphx_glr_plot_eeg_on_scalp_thumb.png

    Plotting EEG sensors on the scalp

    ../_images/sphx_glr_plot_parcellation_thumb.png

    Plot a cortical parcellation

    ../_images/sphx_glr_make_report_thumb.png

    Make an MNE-Report with a Slider

    ../_images/sphx_glr_plot_ssp_projs_sensitivity_map_thumb.png

    Sensitivity map of SSP projections

    ../_images/sphx_glr_plot_evoked_topomap_thumb.png

    Plotting topographic maps of evoked data

    ../_images/sphx_glr_plot_topo_customized_thumb.png

    Plot custom topographies for MEG sensors

    ../_images/sphx_glr_plot_topo_compare_conditions_thumb.png

    Compare evoked responses for different conditions

    ../_images/sphx_glr_plot_clickable_image_thumb.png

    Demonstration of how to use ClickableImage / generate_2d_layout.

    ../_images/sphx_glr_plot_meg_sensors_thumb.png

    Plotting sensor layouts of MEG systems

    ../_images/sphx_glr_plot_evoked_whitening_thumb.png

    Whitening evoked data with a noise covariance

    ../_images/sphx_glr_plot_channel_epochs_image_thumb.png

    Visualize channel over epochs as an image

    Download all examples in Python source code: auto_examples_python.zip
    Download all examples in Jupyter notebooks: auto_examples_jupyter.zip

    Generated by Sphinx-Gallery

    Institutions
    • GitHub
    • ·
    • Mailing list
    • ·
    • Gitter
    • ·
    • What's new
    • ·
    • Cite MNE
    • Back to top

    © Copyright 2012-2017, MNE Developers. Last updated on 2017-08-15.