Color maps can be loaded explicitly by referencing the file name at the unix command line, or they can be loaded by bringing an entire GLM/REM/SRTM/FIT analysis into the display program. See sidebar.
In the first example, all the files except data.nii are loaded as colormaps. The color maps will be loaded in the order specified on the command line. Files preceded by “-P” are loaded as p-value maps, where the displayed value for a voxel with value x in the file is sign(x) * 10^(-abs(x)). Files preceded by “-a” (activation) are loaded as linear maps in which the value in the file is displayed at each voxel.
In the second example, all p-value color maps produced by the GLM analysis specified in file “glm.dat” are loaded into memory, and additionally all signal maps are loaded. The order will be (p-value, signal change) for condition #1, (p-value, signal change) for condition #2, ... The order is important for display of the linear maps, as described below.
Two colorbar scales are stored in memory: 1 scale for all linear maps, and 1 scale for all p-value (or log) maps. P-values are subjected to a threshold defined by the p-value color bar. Linear maps are subjected to two thresholds during display: 1) the threshold defined by the linear color bar, and 2) the preceding p-value map, so that only voxels that are colored in the preceding p-value map and also pass the linear map threshold will be colored. This enables display of signal changes (e.g., BOLD, % CBV, ...) only for voxels that pass a significance threshold.
Display of color maps
When multiple color maps have been loaded into memory, switch between them by placing the cursor on the color bar and using keyboard + and - (with or without the cap key) to move forward and backward through the set of color maps. The file name of each map is shown in the label of the image window. Alternatively, click on the map name below the color bar.
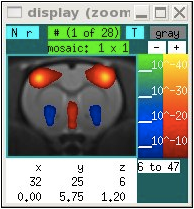
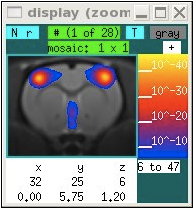
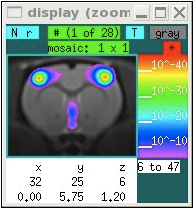
Color maps can be displayed in 5 different ways: 1) both positive and negative values are shown using hot and cold color scales (bottom left), 2,3) Either the positive or the negative tail can be displayed using a blue-red-yellow color scale (bottom middle), 4,5) Either the positive or the negative tail can be displayed using a rainbow color scale (bottom right).
To switch between positive/negative and positive or negative color scale, left-click on the “- +” text buttons above the scale. Alternatively, place the cursor on the color scale and use the left/right arrow keys to switch between all 5 display options. Note that the positive/negative color scales can be switched by right-clicking on the “- +” text buttons above the scale. This is useful when one wants to associate hot colors (“activation”) with decreases in signal intensity, as for instance when using IRON fMRI to measure CBV based upon signal changes that occur after injection of an exogenous contrast agent.
A color overlay can be toggled on/off by hitting the space key or clicking on the gray/color text field above the color bar. The color map can be made transparent by typing “T” or clicking on that text button.
To adjust the limits of the color scale:
- Click on the limits field below the color bar, and enter the low and high values.
- Place the cursor near the lower or upper part of the color bar, and use the up/down arrows to adjust the lower or upper limit, respectively. Alternatively, use your mouse scroll wheel.
- Use the mouse to click on the color bar. A left-click will restrict the range by setting the lower or upper limit to the value indicated by the cursor at the time of the click. A right-click will expand the range by increasing the lower or upper limit by about 20% of the full range.