Using a general linear model (GLM), data as a function of time can be modeled as a linear summation of parameters that multiply time-dependent basis functions, plus noise that encompasses limitations on sensitivity as well as imperfections in the model:
![]()
![]()
Each parameter in the Beta vector represents the magnitude of an “event” that is a user-defined temporal profile; additionally, basis functions generally include baseline offset and drift terms, and other objective regressors that may reduce variance but are not necessarily associated with neural function (e.g., residual motion correction parameters, blood pressure, …). The inverse solution for the vector parameters is
![]()
Statistical significance can be assigned to individual events, to more complicated tests involving differences or sums of events, or to “omnibus testing” or “general effects” associated with more than one type of specific contrast (Friston et al., 1995). Within the standard GLM framework, a contrast matrix or vector is used to define statistical tests. Given two event types, a test for the first event is specified by the contrast vector {1 0}, and the difference of the two events is specified as {1 –1}. To reject the hypothesis that the magnitude of the sum of two events matches the baseline condition, the contrast vector is {1 1}. Alternatively, to perform an omnibus test that one or both events reaches significance, a 2 by 2 contrast matrix is employed: {1 0; 0 1}.
Given the solution of parameters (Beta in equation above) and the contrast matrix as described, the statistical significance of one or more contrasts is evaluated by an F test, where the number of degrees of freedom( Nf) is the number of time points minus the number of parameters that have been fit, and Nc is the number of rows in the contrast matrix.
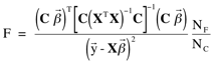
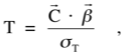
Although the F test is useful to identify statistical significance associated with multiple contrasts, hypothesis testing generally employs a single contrast (Nc=1). In this case, the contrast matrix becomes a vector (C), and the F test produces results equivalent to a T statistic, which is the square root of F for a single contrast:
![]()
![]()
In this GLM implementation, all basis functions in the design matrix (X) are normalized prior to computation of parameters (Beta), so statistical tests compare peak response magnitudes, as opposed to integrated areas. F tests, which are positive by Eq. 3, are given the sign of the maximum magnitude of all contrasts in the test.