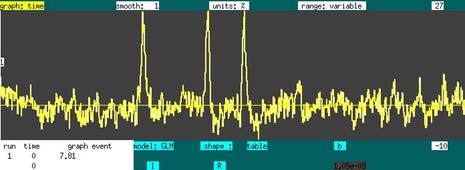
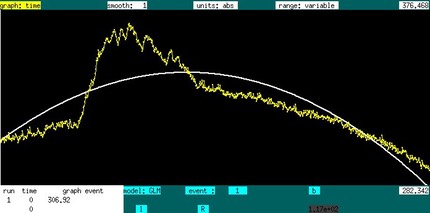
The graph time window provides some useful interactive features for surfing fMRI data by GLM; this feature is particularly useful for investigating responses to pharmacological stimuli, for mapping functional connectivity, or for mapping artifacts. If a file is loaded with > 10 time points, then a simple polynmial GLM is applied to the data, as indicated below, where the baseline is described by 3 terms.
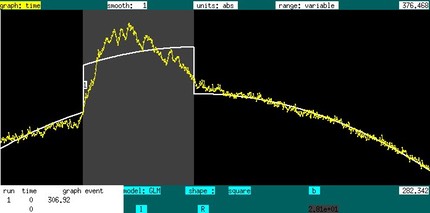
If one advances the "event" field to "shape" and switches "gamma" to "square", then one can specific the beginning of the stimulus with a right mouse click, and the end is defined by the release after dragging the cursor to the specified location, resulting in the GLM below: a baseline plus a square event. The on/off times can be adjusted by repeating this process in a way that overlaps with the original interval. If a non-overlapping interval is specified, and new stimulus is inserted for the same event.
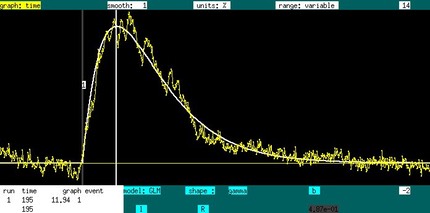
For this particular response (cocaine in NHP basal ganglia using IRON fMRI), it would be appropriate to use a gamma-variate response. If the square event is deleted (right click & release on interval with no drag), the shape can be changed to "gamma" and then redrawn. The right click specifies a nominal start time, and a gamma function is fit to the data over the interval between the click & release. The program will prompt the user to see if the start time should be varied as well. The time-peak-response, and possibly also the start time, will be varied across a 1D or 2D grid, and at each point all GLM parameters will be fit and the chi-squared determined. The minimal chi-squared fit is selected. To fix the time-to-peak response, set the time point (left click) to the desired value, and redraw the event (right click, drag, release). This is shown below, with the baseline removed and units converted to percent. Note that the gamma end time is always the end of the run. Delete, modify, or create a new gamma stimulus just as done for the square, with the corresponding interval being the time between onset and time-to-peak.
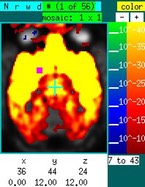
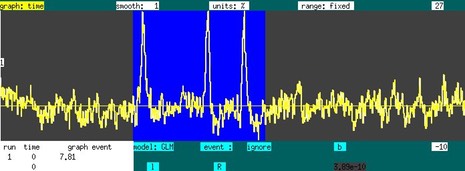
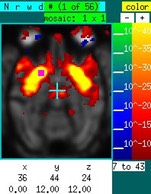
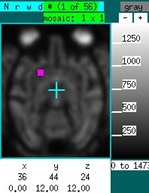
Suppose now that you want to investigate "functional connectivity" in the absence of a stimulus. The graph below shows a time series, corresponding to the purple square in the image on the sidebar, in the absence of a stimulus in an NHP under isoflurane. Using a "table" event, draw over the graph at any location with the right mouse button depressed. The entire time series is selected as a regressor. Hitting "P" then generates the map to the right of the time series. Based upon previous experience, this map reflects isoflurane-induced burst suppression (i.m.h.o.). Now ignore the time data containing the large spikes and remake the map using "P". The corresponding image shows that right putamen is highly correlated with left putamen. To pre-filter the data across a range frequencies, click on the “model:GLM” text field to switch to a Fourier-transformed vector, set the band-pass filter, and switch back to the time-domain data.