Loading
Image files can be displayed individually or together (if dimensions match).
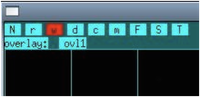
Overlays can be defined interactively or loaded as a set in a standard space.
Various time models (GLM, SRTM, T2-fitting, …) can be loaded in order to display fitted models along with data and also to load associated parameter or statistical maps.
Orientation
Use the “-3” startup option to start in tri-plane mode. Interactively, use keyboard “3” to switch back and forth between this mode and mosaic mode. Use “Z” and “z” to increase and decrease the window and image zoom factors. Use “y” to flip images up-down. Select a subset of images to mosaic using the “#” text button or keyboard stroke.
Windowing
1) Use keyboard "i" or text button "i" to auto-window.
2) Do the same in conjuction with an overlay, created by clicking the right mouse button and dragging downward to the right.
3) Left-click the mouse button, hold and drag on the image window. Up-down changes intensity, and left-right changes contrast.
4) Use the gray-scale bar on right side of the image window. a) Set the window explicitly by clicking on the scale below the bar. b) Use the mouse scroll wheel, left button, or right button to adjust the window limit nearest the cursor. c) Use up or down arrow on the grayscale bar in the same manner.
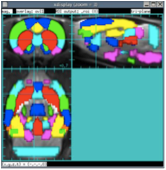
Templates
Register data to standardized spaces using MRI templates. Templates associated with atlases are provided for mice, rats and monkeys. The corresponding atlases are the Allen Mouse Brain Atlas, the Paxinos-Watson atlas for rats, and the Saleem-Logothetis atlas for NHP (rhesus). After registration, MRI coordinates match atlas coordinates.
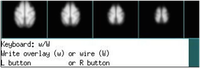
Overlays & wire frames
Overlays provide region-of-interest analyses, whereas wire frames highlight ROIs. Overlays are associated with voxels and are specific to a resolution, whereas wire frames are associated with coordinates and can be used across resolutions.
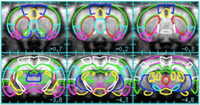
Color maps
Color maps can be loaded using log scales for p values or linear scales for effect sizes (e.g., % signal, % CBF, % CBV). Colors can show positive or negative tails, or both. Maps can be log or linear.
Help
Get help here, from the command line (xd -h or xd -H), or interactively (h or H text buttom or keys, or ? button). When text keys are selected, look to the information area in the bottom left corner for guidance.