A “time model” in fastmap refers to a form of time-series analysis and all file associated with the analysis. Generally, each analysis should be given a separate directory. The directory will contain a control file named “timeModel.dat” that specifies the type of model and the set of scans/files to include in the analysis, plus a set of output files (maps), plus a startup file named “fastmap” that includes all fastmap arguments to load the time model and maps. Thus, to reload the time model into model, one only needs to either
1) navigate to a time model directory and a invoke the program without arguments (arguments will read from file “fastmap”), or
2) select a directory from the list of recent time models using a fastmap menu.
Fastmap includes a variety of common models for time-series analysis, including
- fMRI/phMRI GLM analyses for rapid responses (fixed HRF, or IRF fitting), drug-induced responses, etc.
- PET reference region kinetic analysis using pseudo-GLM approaches (MRTM, MRTM2) or forward-model nonlinear fitting
- PET SUV (specific uptake volume)
- T1 mapping based upon inversion-recovery magnitude images
- T2 mapping based upon multiple echo times
- ADC mapping based upon multiple b-values
- DTI tensor-based analysis with tract tracing by tensor deflection
- mixed and random effects second order GLM for cross-subject analysis based upon the summary statistics approach
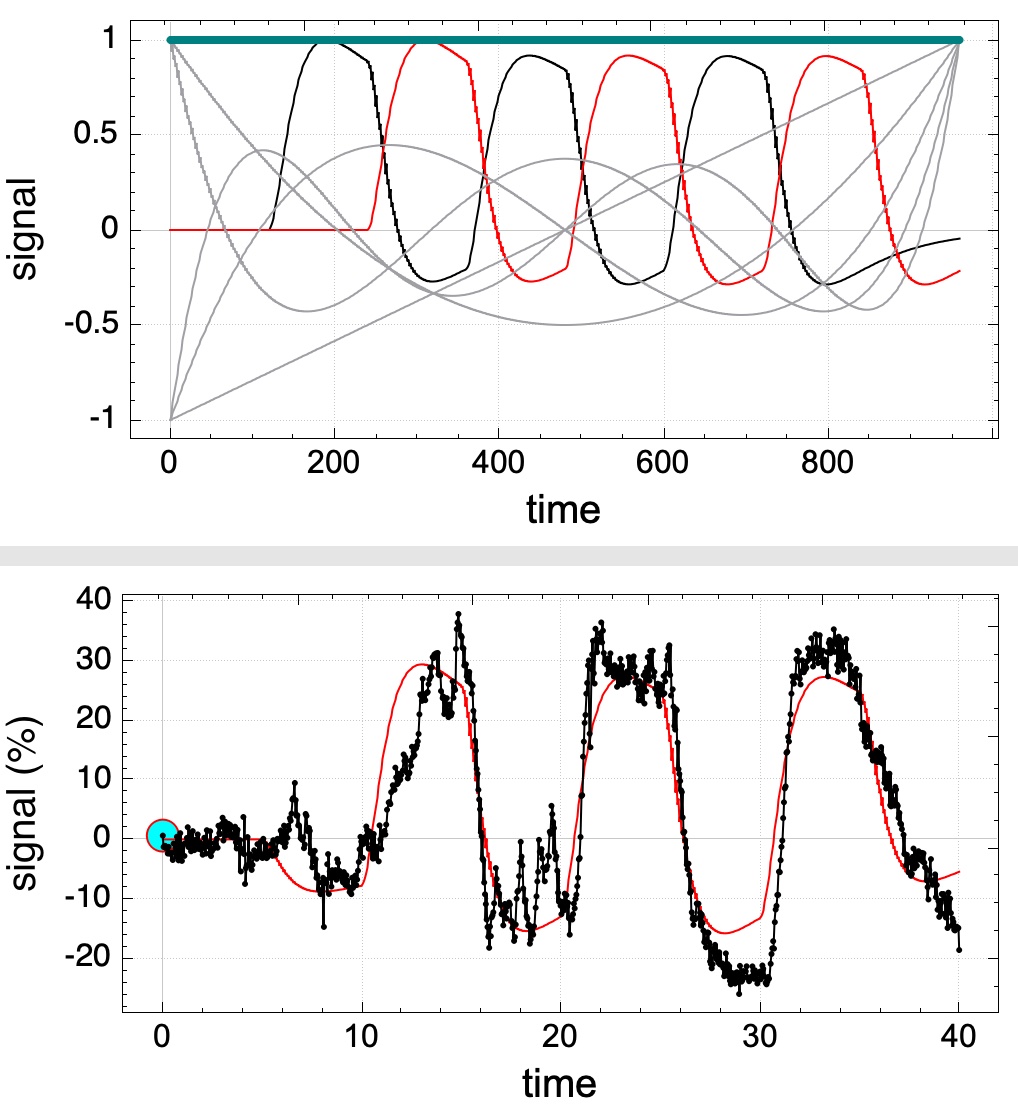
Most of these method rely upon the general linear model (GLM). In these cases, one can show both the fit and the basis functions to help guide design of the analysis model (right). The current event selected in the time-model widget panel will be highlighted in red in the basis function graph.
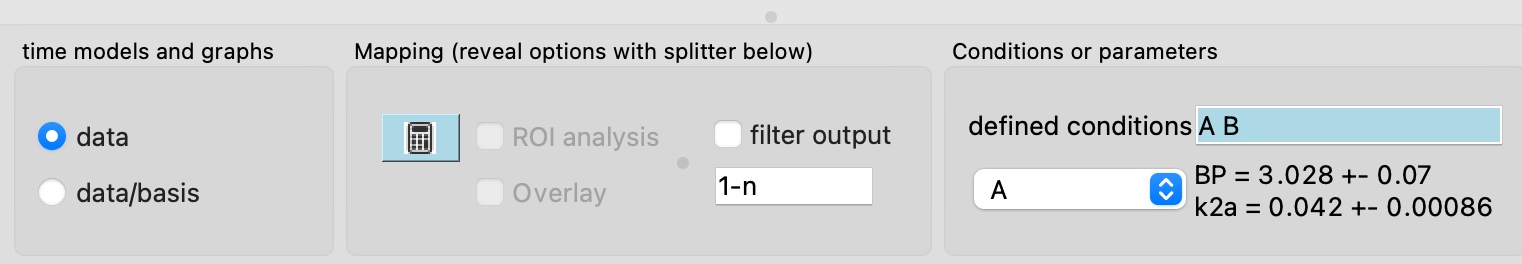
To perform voxelwise mapping, use the mapping calculator button. If a set of predefined overlays is checked, then clicking “ROI analysis” will perform an analysis using the ROIs (but shown as maps of ROIs). Clicking “overlay” will restrict an analysis to the current overlay shown on the image window (e.g., to ignore everything outside the brain, or to speed up analysis). “Filter output” will stream output files named “filter.nii” to contain whatever is shown on the graph (e.g., baseline corrections, converted to percent, some or all fMRI events regressed out, …).