Loading
Images can be loaded from the command line or interactively via the menus. Anatomical templates and atlases load into anatomy space, and other data load into the time-series space. A “time-model directory” consists of a time-model file named timeModel.dat, which specifies the time model and the set of time-series files, plus a “fastmap” file providing command-line options, plus output files from the time-series analysis. Color files (p-values, BPND, etc.) are loaded into the time-series space as overlying maps on the grayscale images, and they will be connected to the anatomical space if dimensions match. Overlays are voxel lists that define regions of interest as either binary or non-binary (0 to 1) averaging regions; they load into either or both spaces depending upon whether dimensions match.
Crosshair & overlays
The cross-hair can be repositioned using the left mouse button, the mouse wheel (through plane), and the keyboard arrows. Interpretation of mouse/key input is dependent upon the location of the cursor. The time-series graph will show the data at the crosshair location unless an overlay is active, in which case it will show the average signal across the overlay.
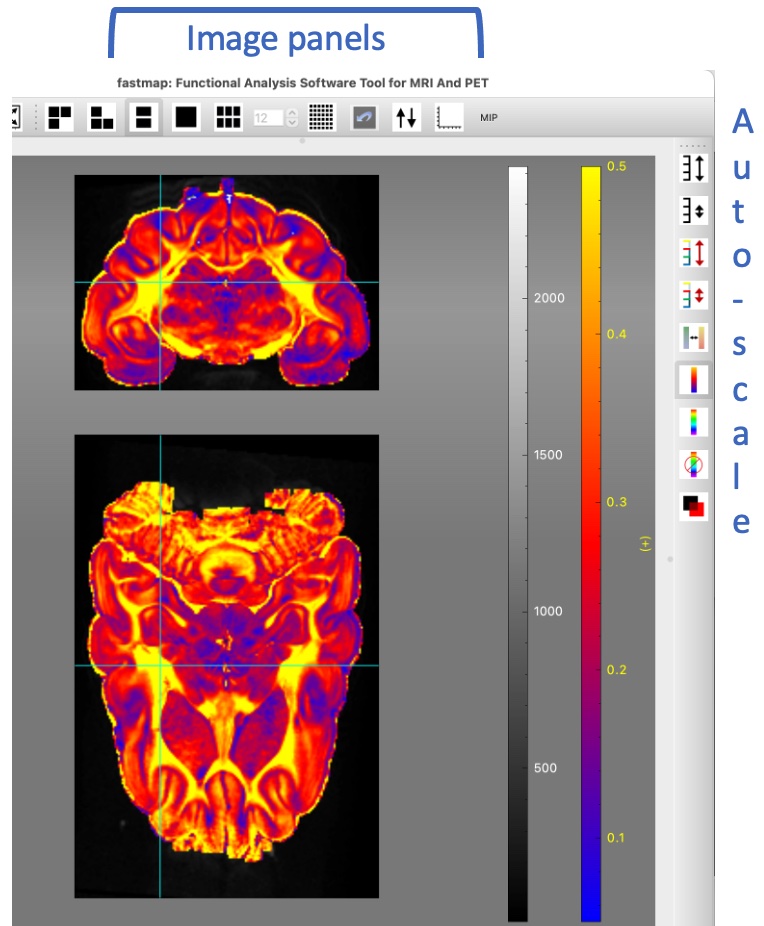
Windowing
Gray-scale and color bars are shown to the right of the image data. With the cursor positioned on the gray-scale bar, use right-click-“set limits” to explicitly set the gray-scale range. If the cursor is positioned above the halfway point of the bar, use the mouse wheel or keyboard arrows to change the upper range. Likewise, change the lower range with the cursor positioned below the halfway point on the bar. Identical methods adjust the color bar range. Gray-scale and color ranges can be auto-scaled using the buttons on the right side of the image. Refer to tooltips for more functionality. The left side of the image window (not shown here) contains buttons for drawing, reading, writing, and selecting regions of interest interactively. Pre-defined regions of interest can also be loaded as lists of voxels (“overlay lists” in fastmap parlance) and can be shown and selected individually or in groups using the functionality of the overlay panel, which can be displayed on the right side of the image window.
Orientation
Images are shown either as orthogonal planes or as mosaics; this is controlled by the panel buttons on the top of the image window (see left). Images can be swapped up/down, and mosaics can be displayed in any of the orthogonal orientations. To rotate volumes, use the alignment preprocessing panel. To simply rotate a volume, load the same volume(s) into the anatomical space to provide the reference and then rotate data in the time-series space (e.g., fm data.nii -a data.nii and then open the alignment panel). Use the left mouse button, the keyboard arrows, or the mouse wheel to move the crosshair through the image volume.
Help
Get help here, from the help menu in fastmap, or (perhaps best) from tooltips attached to all buttons/widgets.